
What powers observability with RUM tools?
Real User Monitoring (RUM) is the ability to measure the performance of your website / web application as seen by your end users. Some of the measurements are well-supported, some are browser specific and a few standards allow observability by letting you decide the measurement parameters. In the plethora of tools, it is hard to understand the differences. With this post, I would like to provide you a firm foundation on the minimum supported provided by the RUM solution for some solid measurements.

Navigation Timing API
In the old days of wild-wild west, the performance measurements were instrumented using custom Javascript code. The challenge was the measurement would begin only after the base HTML was downloaded and the JS code executed.
With the advent of NavTiming API, the browsers provide an interface called PerformanceTiming. Browser implementations make a promise to implemen this interface and populate it with a whole gamut of timers. Without going into a lot of details, here are the measurements that are promised by this interface.
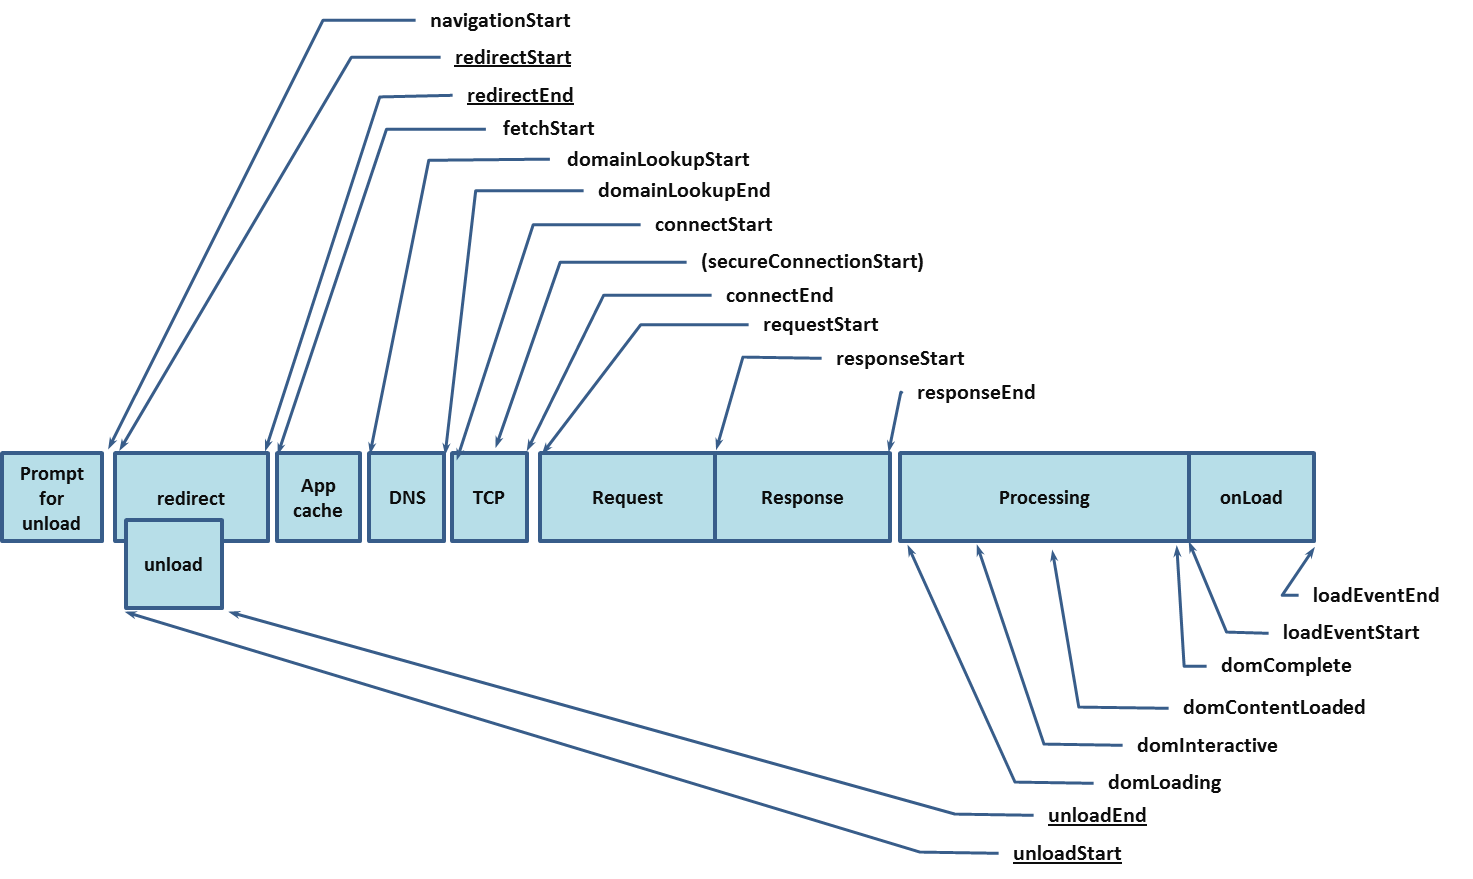 Source: https://www.w3.org/TR/navigation-timing/timing-overview.png
To access the details on your browser, simply open the developer tools. On the console, type the command to see the measurements being collected as part of NavTiming.
window.performance.timing
Resource Timing API
Navigation Timing API is very good to provide details on the performance of your base document. However, it cannot provide the lower level information around the loading of the embedded resources. For example, if you want to check the loading time for your bootstrap library code, the NavTiming API cannot provide the data.
Resource Timing API was introduced to give your granular information on the performance of resources that goes into page construction. This spec defines an interface named PerformanceResourceTiming. Browsers implement this interface and can provide you with granular details on the resources. Here are the details you will receive from your browsers:
 Source: https://www.w3.org/TR/resource-timing-2/timestamp-diagram.svg
To access the resource timing details, type this on your browser’s console.
window.performance.getEntriesByType("resource")
This will provide an array of measurement for each of the resource loaded on the page. This array has a maximum length of 150 but, it can be extended, if required.
User Timing API
NavTiming and Resource Timing APIs are highly standardized. They can provide a set of measures that are common. However, if you need to measure something cutom - say the time it took to load a product image, the standards are not helpful. To solve this, developers would instrument code using Javascript’s Date.now() method. However, this method was dependent on the browser vendor.
With the User Timing API, the spec provides a high precision timestamp (also called as DOMHighResTimeStamp) that has a well-defined requirement. Due to this, the implementation across browsers is similar and the measures are thus comparable. This spec introduces 2 new interfaces PerformanceMark and PerformanceMeasure. Basically, you mark the beginning of something and then measure when the thing is ready.
Paint Timing API
Paint Timing API basically defines 2 different metrics - First Paint and First Contentful Paint. Here’s how the spec describes the 2 events:

First Paint entry contains a DOMHighResTimeStamp reporting the time when the browser first rendered after navigation.
First Contentful Paint entry contains a DOMHighResTimeStamp reporting the time when the browser first rendered any text, image (including background images), non-white canvas or SVG.
Browsers implement PerformancePaintTiming interface. To get this information, you could try this command on the browser console.
window.performance.getEntriesByType("paint")
Note that support for this API is limited and not all browsers will report these times.
Network Information API
One of the questions a lot of website operators receive is to accurately detect the current connectivity condition for a device and to tailor the response based on it. There are a lot of static IP to connection type mapping solutions but, none of them are as reliable as trying to get the information directly from the browser. With this idea in mind, the Network Information API was released. On Chrome, it provides 3 pieces of information:

- effectiveType: 3g, 4g, etc
- downlink: Download bandwidth as seen on the device
- rtt: Round trip time for requests
Using the 3 things, it would be possible to say reduce the quality of an image or deliver a lower bitrate video file.
Spec: https://developer.mozilla.org/en-US/docs/Web/API/Network_Information_API
Long Tasks API
Frequently, when a website has a lot of code being executed, it can result in a bad user experience. This manifests itself with 4 common symptoms:
- Delayed “time to Interactive: Main thread of the browser is blocked and this causes a delay in getting the page to an interactive state.
- High/variable input latency: Actions like clicks or mouse movements are delayed
- High/variable event handling latency: Even handlers experience a delay before the call-back events are fired
- Janky animations and scrolling: Responsiveness is slow causing jerks or jumps in scrolls or animations.
To identify such delays, the Long Tasks API was proposed. A Long Task is basically any script execution over 50 ms that cause one of the above problems.
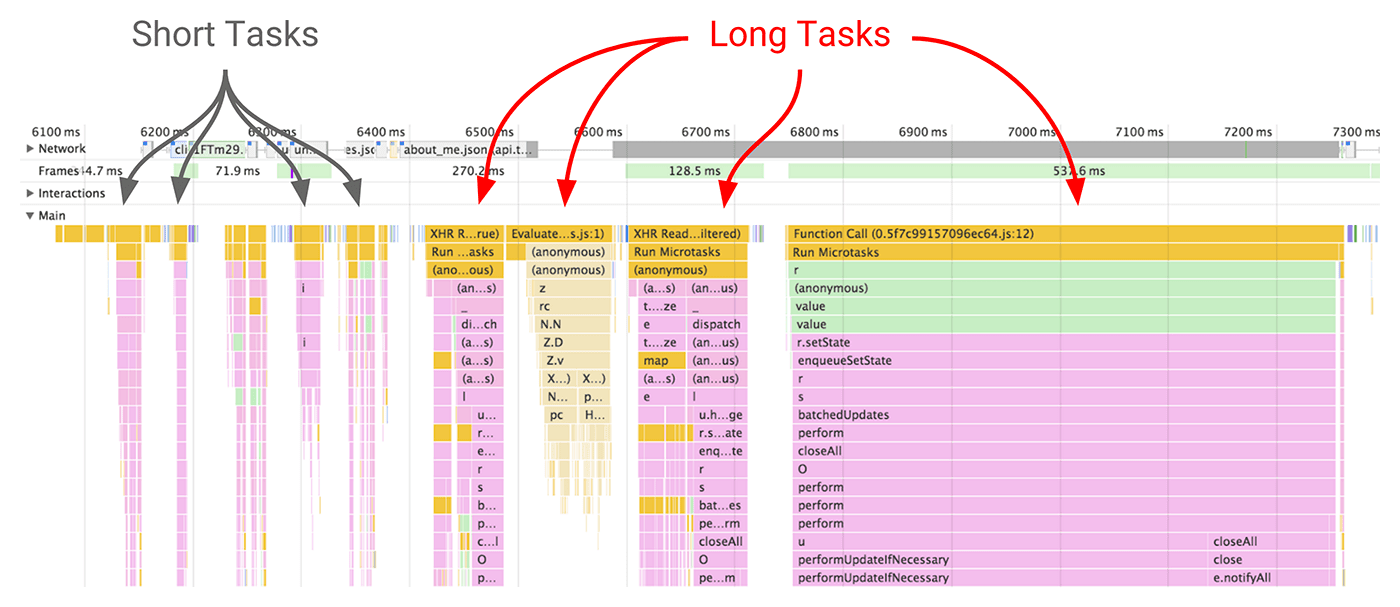 Source: https://developers.google.com/web/fundamentals/performance/images/perf-metrics-long-tasks.png
Server Timing API
When trying to measure the latency, it is quite important to understand to break down the response into the think time of data center versus the network latencies. Using Server Timing API, it is possible for all the parties like data center, CDN, proxies to introduce a Server-Timing header. According to the spec,
Server-Timing header field is used to communicate one or more metrics and descriptions for the given request-response cycle.
For example, when using Akamai, you may see the following response headers:
Server-Timing: edge; dur=96
Server-Timing: cdn-cache; desc=HIT
In this instance, it just shows the turn-around time from Akamai Edge server was 96 ms when the object was served from cache. This is especially useful when we’re trying to troubleshoot performance issue and need to break-it down as a origin, CDN or some proxy issue.
Summary
In terms of support, Chrome supports pretty much everything. Opera too is quite decent in its support followed by Firefox. Safari is generally the new IE when it comes to providing support for observability! To know the current status of implementation, you can refer to one of these resources:
- MDN: On the Mozilla’s MDN website, search for a standard. It will generally have the spec and support details. Although the website is owned by Mozilla foundation, the browser vendors have decided to pool the resources and update the documents on this single website. Personally, I consider this the single source of truth, followed by the W3C website.
- CanIUse: https://caniuse.com/. This website provides an easy to understand view and is generally well updated. If there is a conflict between MDN and this website, I will go with MDN.
Adjacent Support
All the different APIs I’ve described earlier are the standards necessary for to provide good measurement. Apart from the measurement standards, there are security headers that can prevent your RUM solution from observing third party resources. Here are the 3 primary ones:
Beacon API
According to the spec, the Beacon interface
is used to schedule an asynchronous and non-blocking request to a web server. Beacon requests use the HTTP POST method and requests typically do not require a response. Requests are guaranteed to be initiated before a page is unloaded and they are run to completion, without requiring a blocking request.
This is the mechanism using which RUM libraries like Boomerang submit the real user monitoring metrics.
Spec: https://developer.mozilla.org/en-US/docs/Web/API/Beacon_API
Timing-Allow-Origin (TAO)
When you are trying to measure the performance of third parties, the timing information is typically blocked from being shared. The Timing-Allow-Origin response header
specifies origins that are allowed to see values of attributes retrieved via features of the Resource Timing API, which would otherwise be reported as zero due to cross-origin restrictions.
So if your website is www.customer.com and it uses a font from a 3rd party website www.customwebfonts.com, the fonts domain should include a TAO header like this:
Timing-Allow-Origin: *
Timing-Allow-Origin: https://www.customer.com
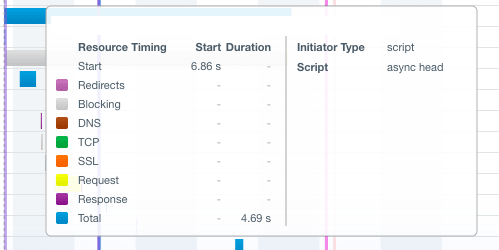
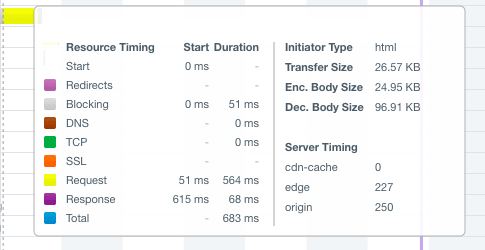
If the header is present, the RUM solution can capture the timing information provided through Resource Timing API. If this is not available, it will just report the entire time from start of request to end of download as one simple period. If you were using the Akamai’s mPulse solution, here’s how the addition of the header will change the report.
Without TAO
With TAO / Same origin
More details: https://developer.mozilla.org/en-US/docs/Web/HTTP/Headers/Timing-Allow-Origin
Conclusion
We’ve walked through the underlying APIs that power the Real User Monitoring (RUM) solutions. There is work being done to instrument the measurement on SPA frame-works and to measure the time to load certain elements like the element timing.