AWS ReInvent Recap
This year, I got a chance to attend the AWS re:Invent conference held in Las Vegas from November 28th to December 1st. It felt great to be back at an “in-person” event. The overall focus appeared to be on AI/ML. The content varied from setting up large, complex and ultra-powerful clusters to non-technical aspects like identifying & communicating bias in AI models. Apart from that, I got a chance to attend sessions on HTTP/3, Web Performance Metrics measurement and learning the Working Backwards principle of Amazon. Here are my notes.
BOA318: Build a fitness activity tracker using machine learning
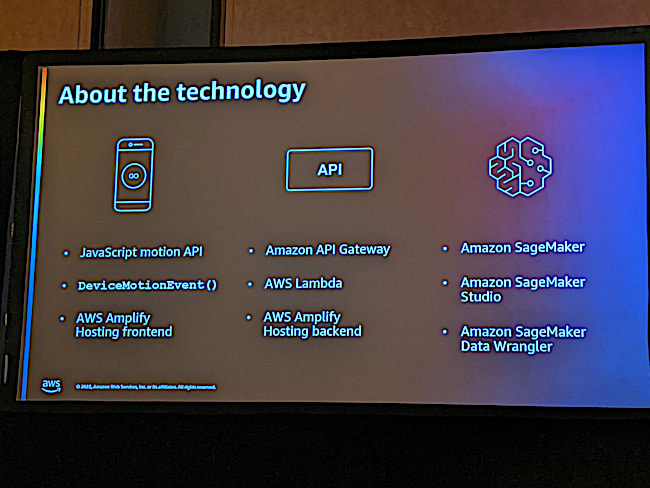
The session was intended to help us understand machine learning. However, I may have been over-optimistic in my selection :-) This session probably required attendees to know a lot about ML and training models. So it kind of went over my head. For those interested, here is the overall architecture used in this session.
Accelerating high performance video transcoding with Amazon EC2
This was a very interesting session. I learnt 2 new things.
High Efficiency Streaming Protocol (HESP)
In this session, the presenters spoke about a mechanism of achieving ultra low latency streaming. Unlike normal streams, HESP has:
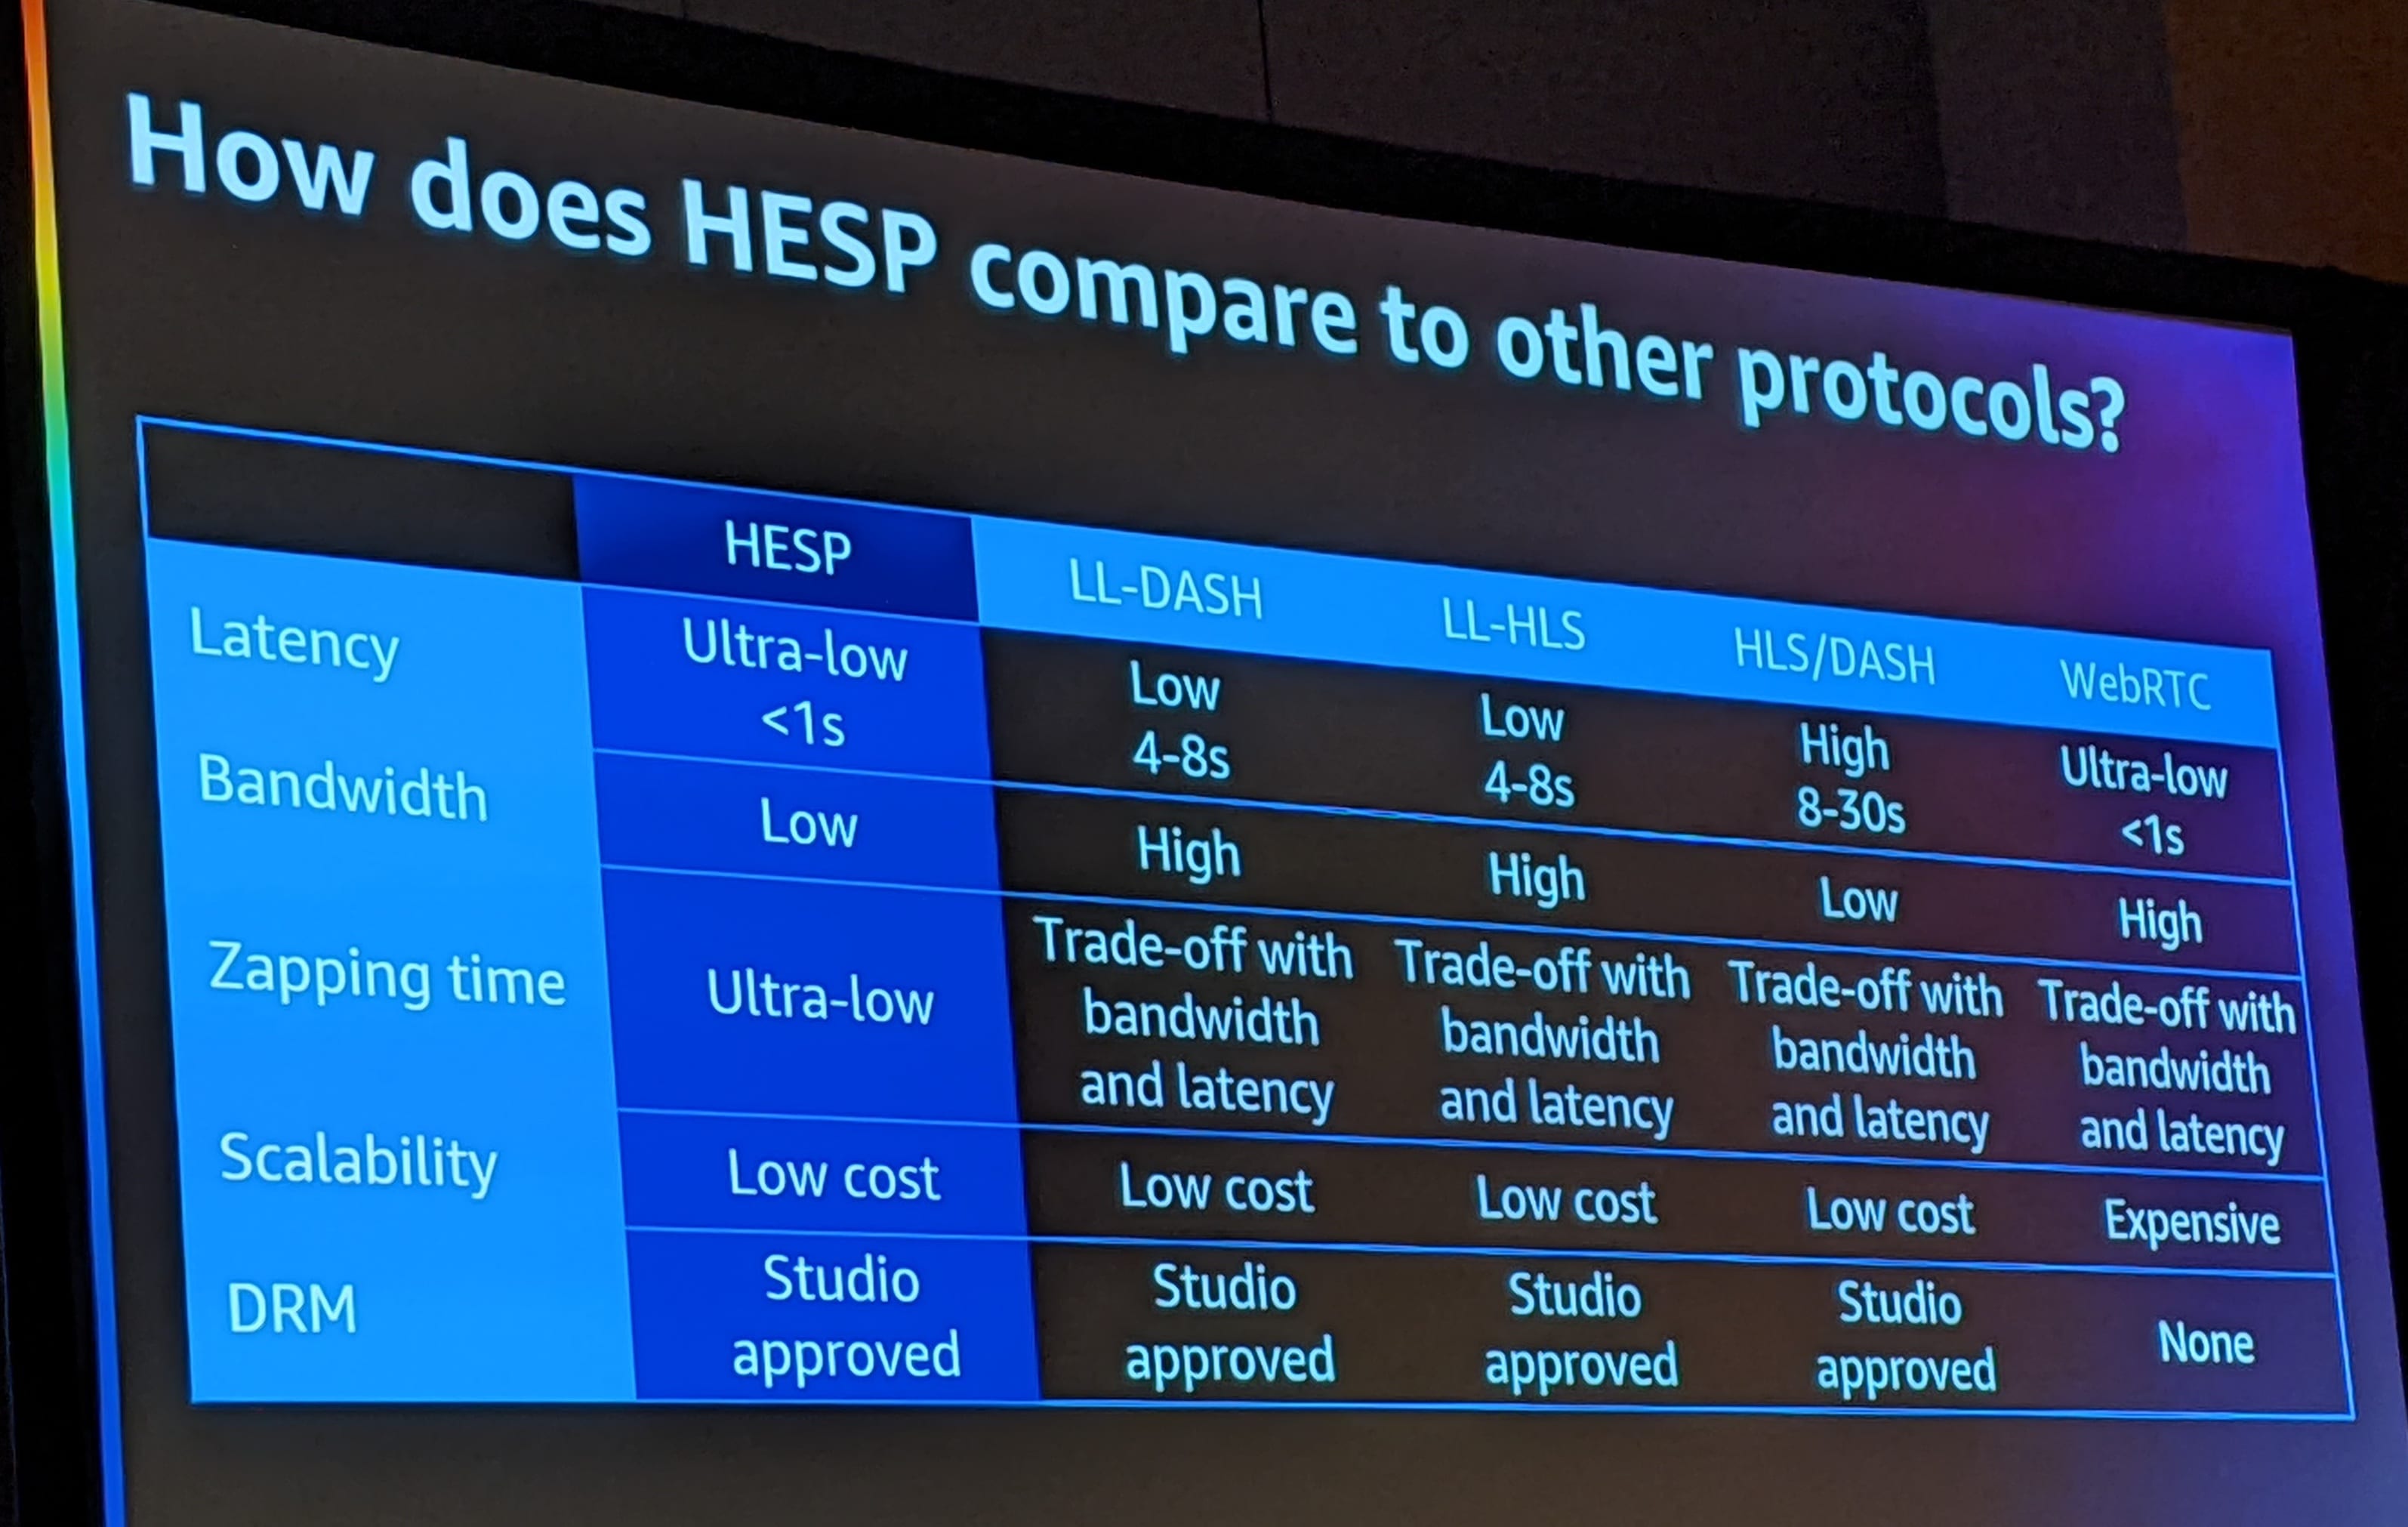
- HESP uses lower amount of buffering as compared to regular streaming
- Every resolution in HESP has 2 streams - a supported resolution and a lower version stream to quickly switch if needed.
- Each frame has an initialization stream. So switching between resolution is very easy.
- So if the player had switched to a lower resolution frame, once the play back completes, the player can easily switch to the higher resolution frame immediately.
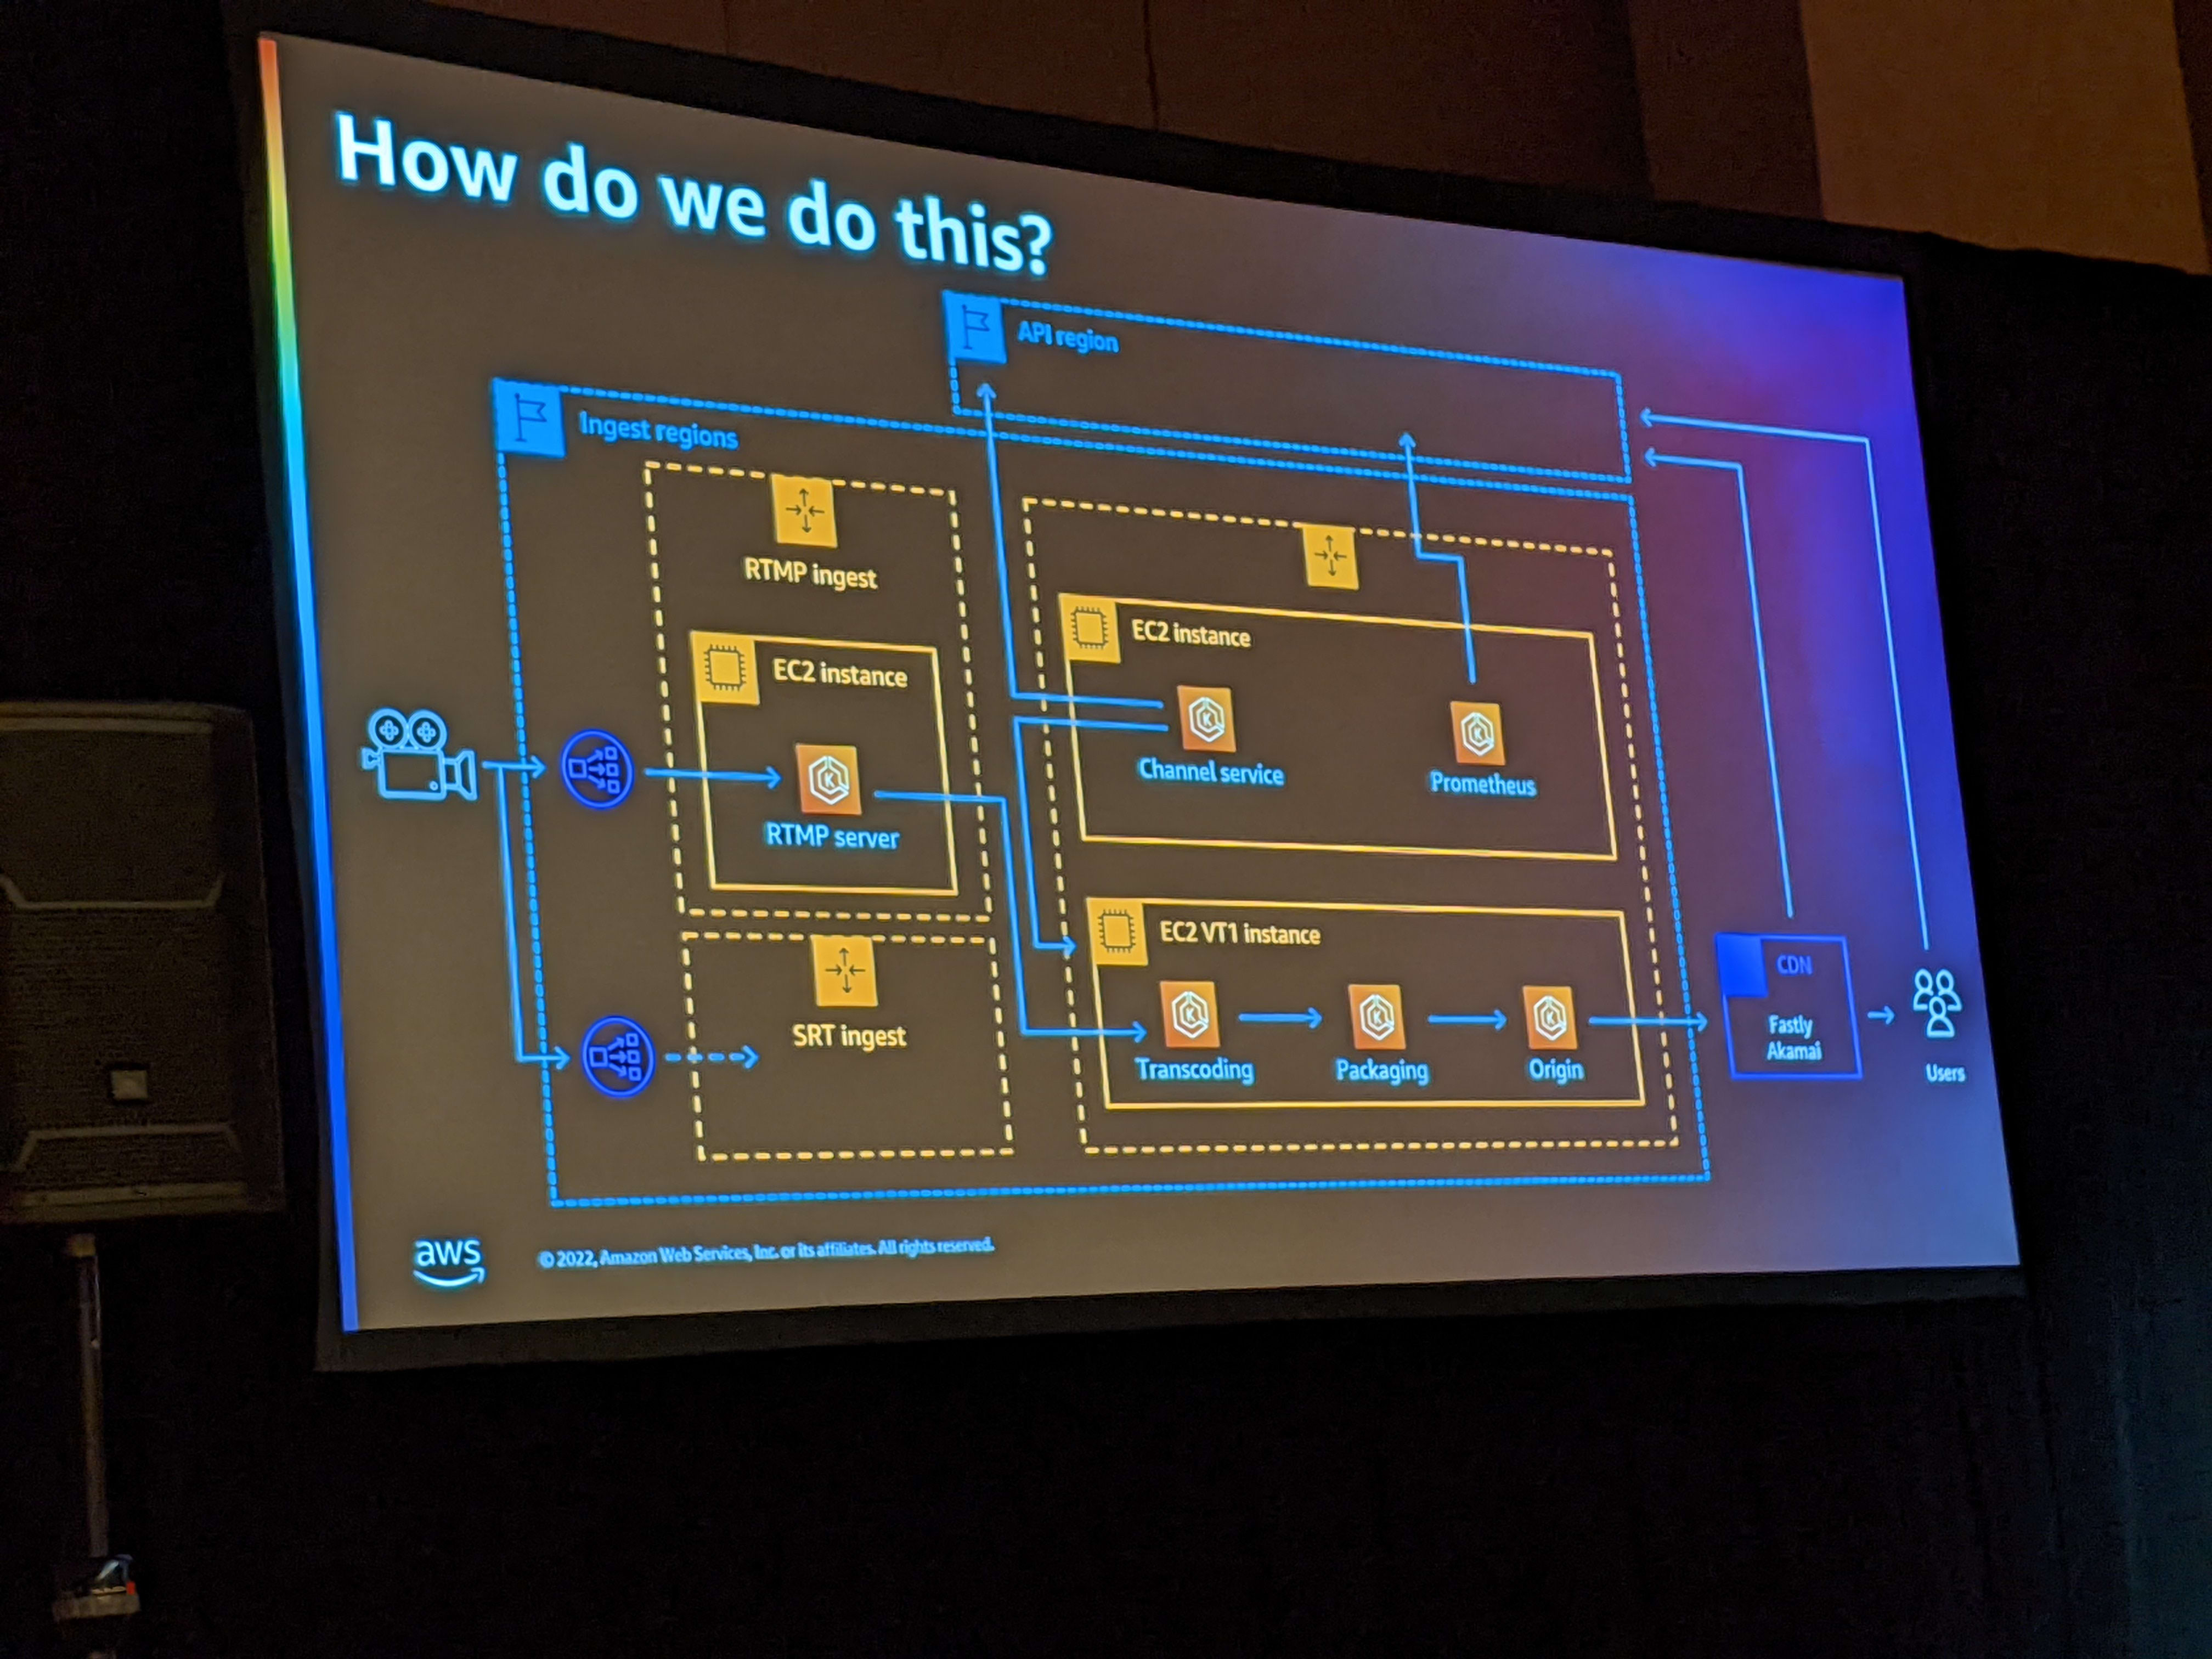
The challenge with HESP is the rapid encoding requirements from ingest to delivery - especially when handling live streams. For this, the presenter proposed the use of Xilinx EC2 instances.
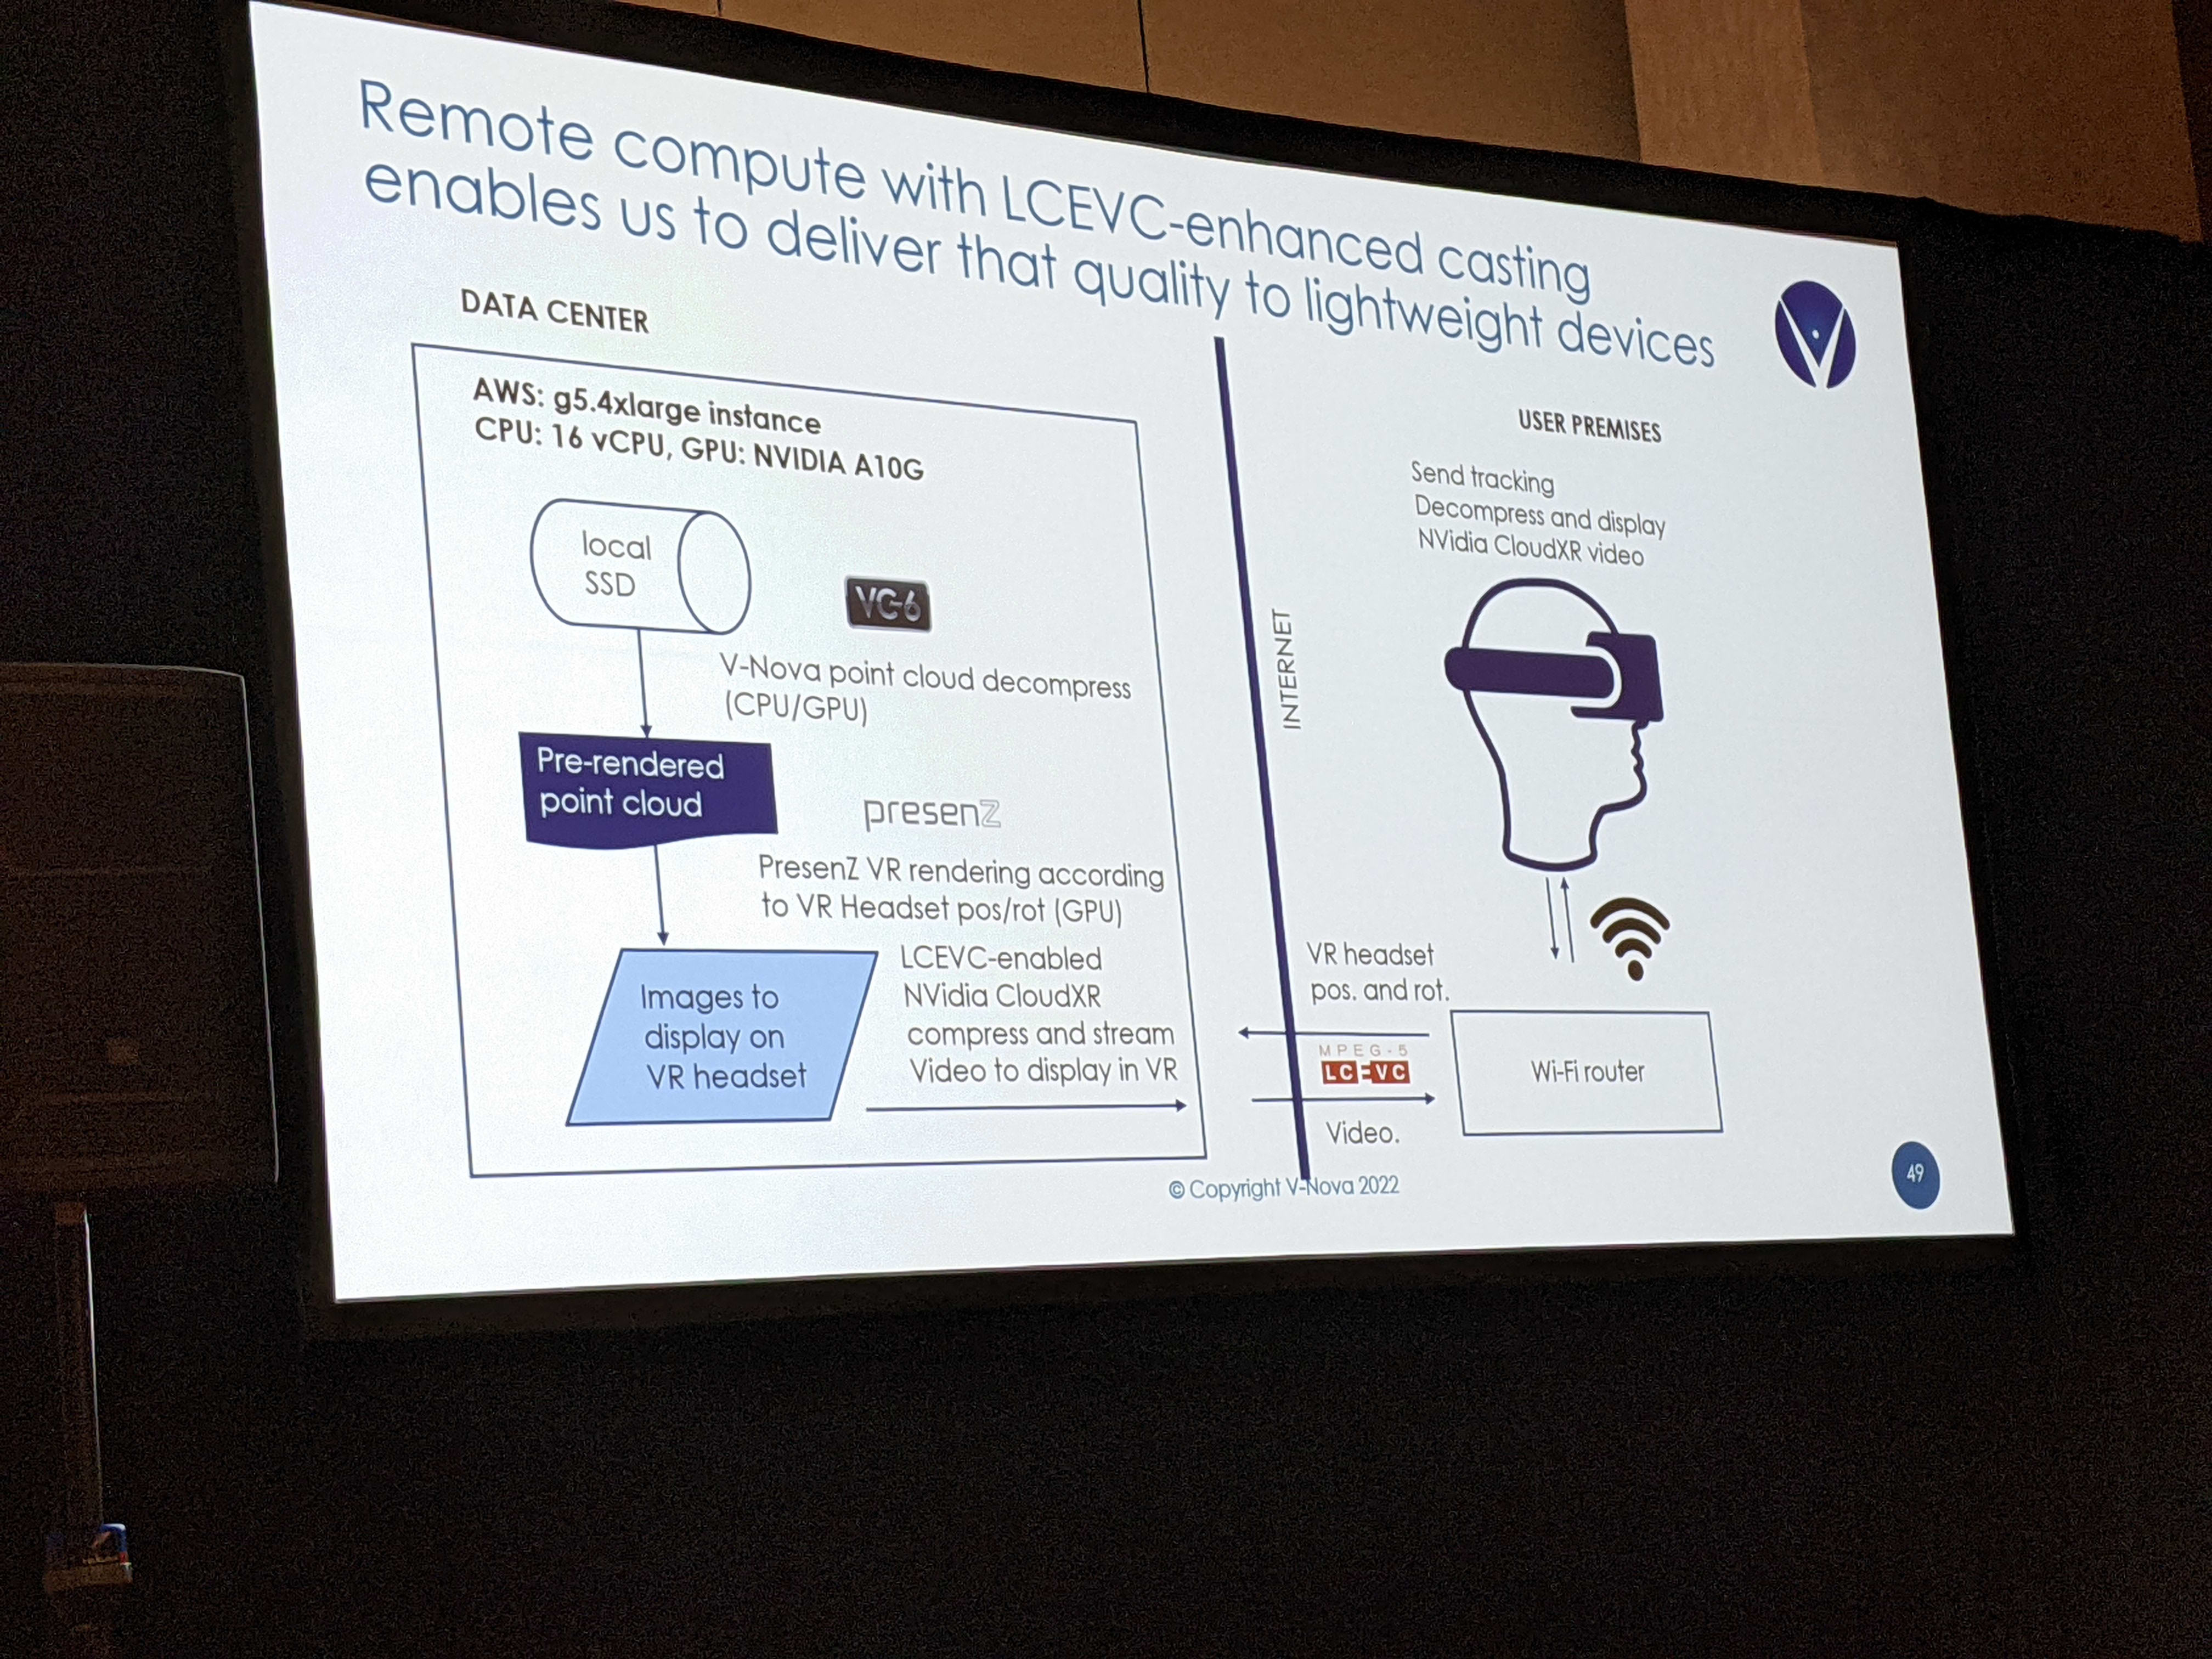
LC-VC by V-Nova
The second part of the session was by V-Nova. They presented on the topic of LCVC enhancement of codecs. They spoke about the ability to convert existing still images and videos into immersive 6 degrees of freedom experience. Since such experiences are going to be common, there is a need for delivering rich experience as well. However, coding-decoding on device is limited by the headset capabilities. So they proposed that the computing should be split between CDN and device. In fact, they coined a term, Graphics Delivery Network (GDNs) for handing these kind of content.
COM304: Detect and resolve biases in artificial intelligence
Virginie Mathivet
Modern Data Manager
TeamWork
- Every model has a bias in AI. Eg Google Translate has issues with gender.
- Bias notebooks: https://github.com/VMathivet/reinvent2022
- In most cases, biases don’t come from the scientist but from data.
- Explainable AI (xAI) - ability to explain the underlying AI rules.
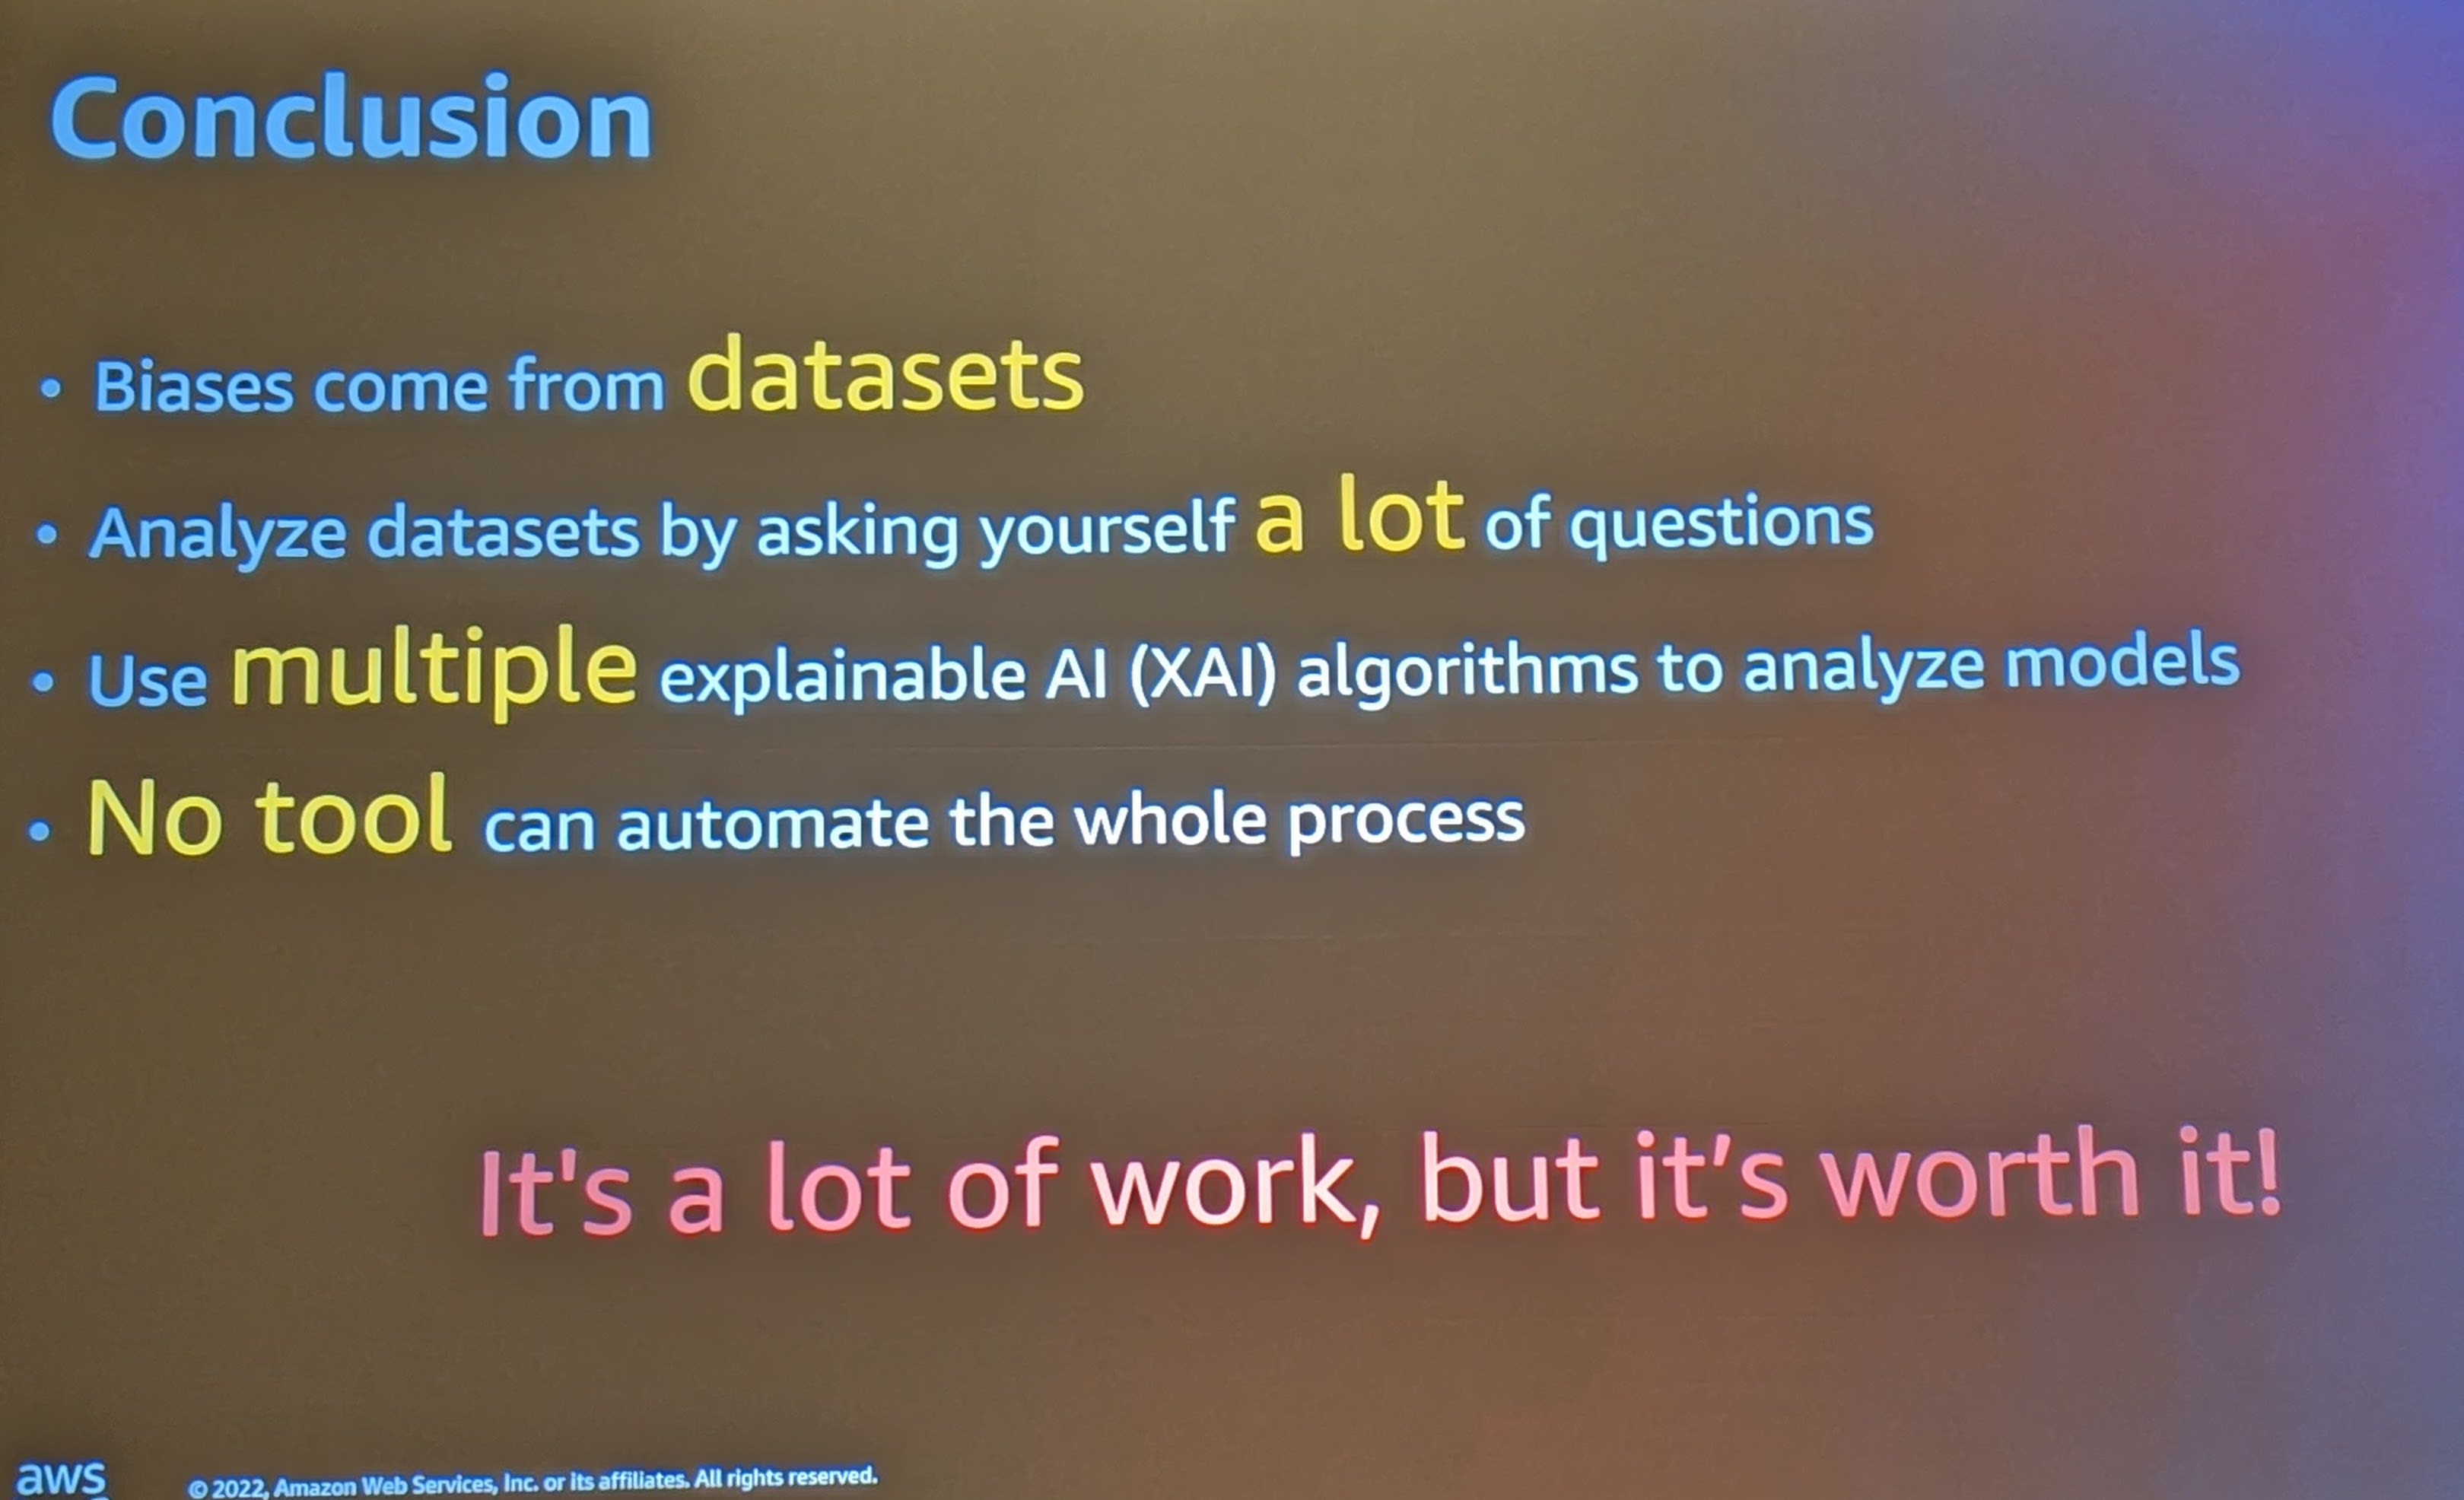
Here are the broad points that she was trying to make during her talk.
NET401: Deliver great experiences with QUIC on Amazon CloudFront
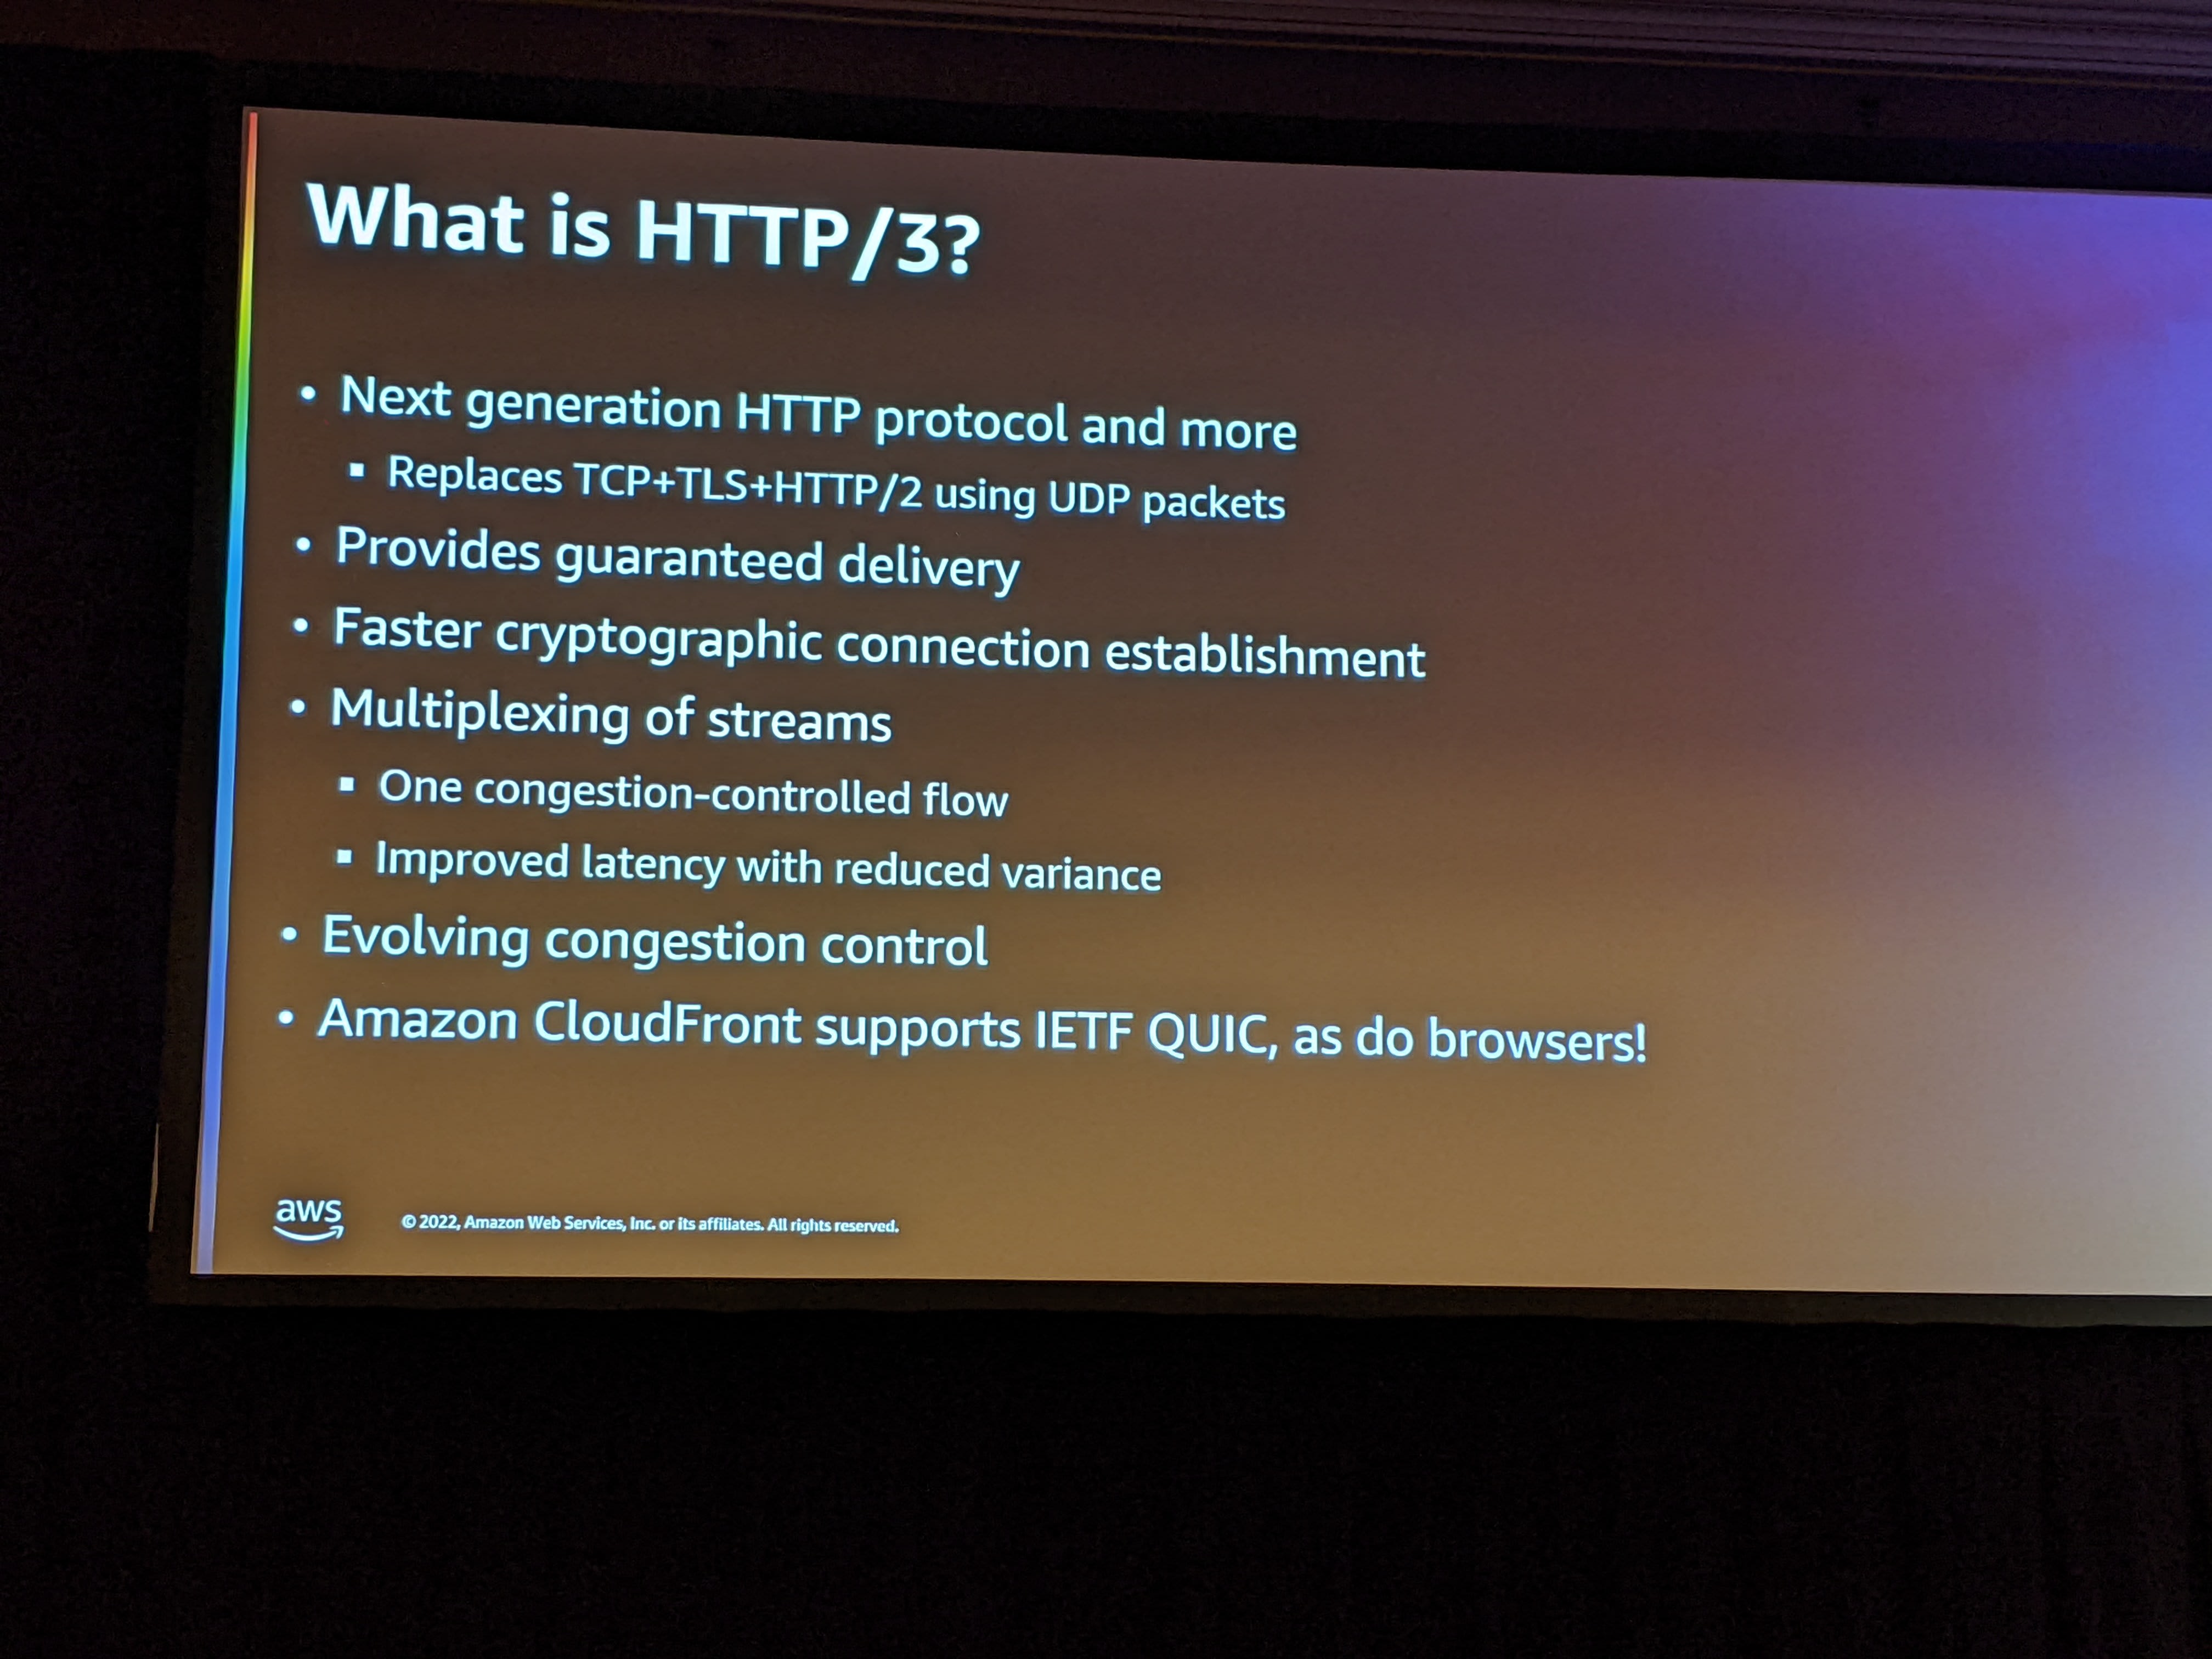
Presented by Jim Roskind, this was an incredible journey on the evolution and thought process that went into the creation of IETF QUIC protocol that has ultimately become the HTTP/3 protocol. Here are some slides that I noted down.
What is HTTP/3
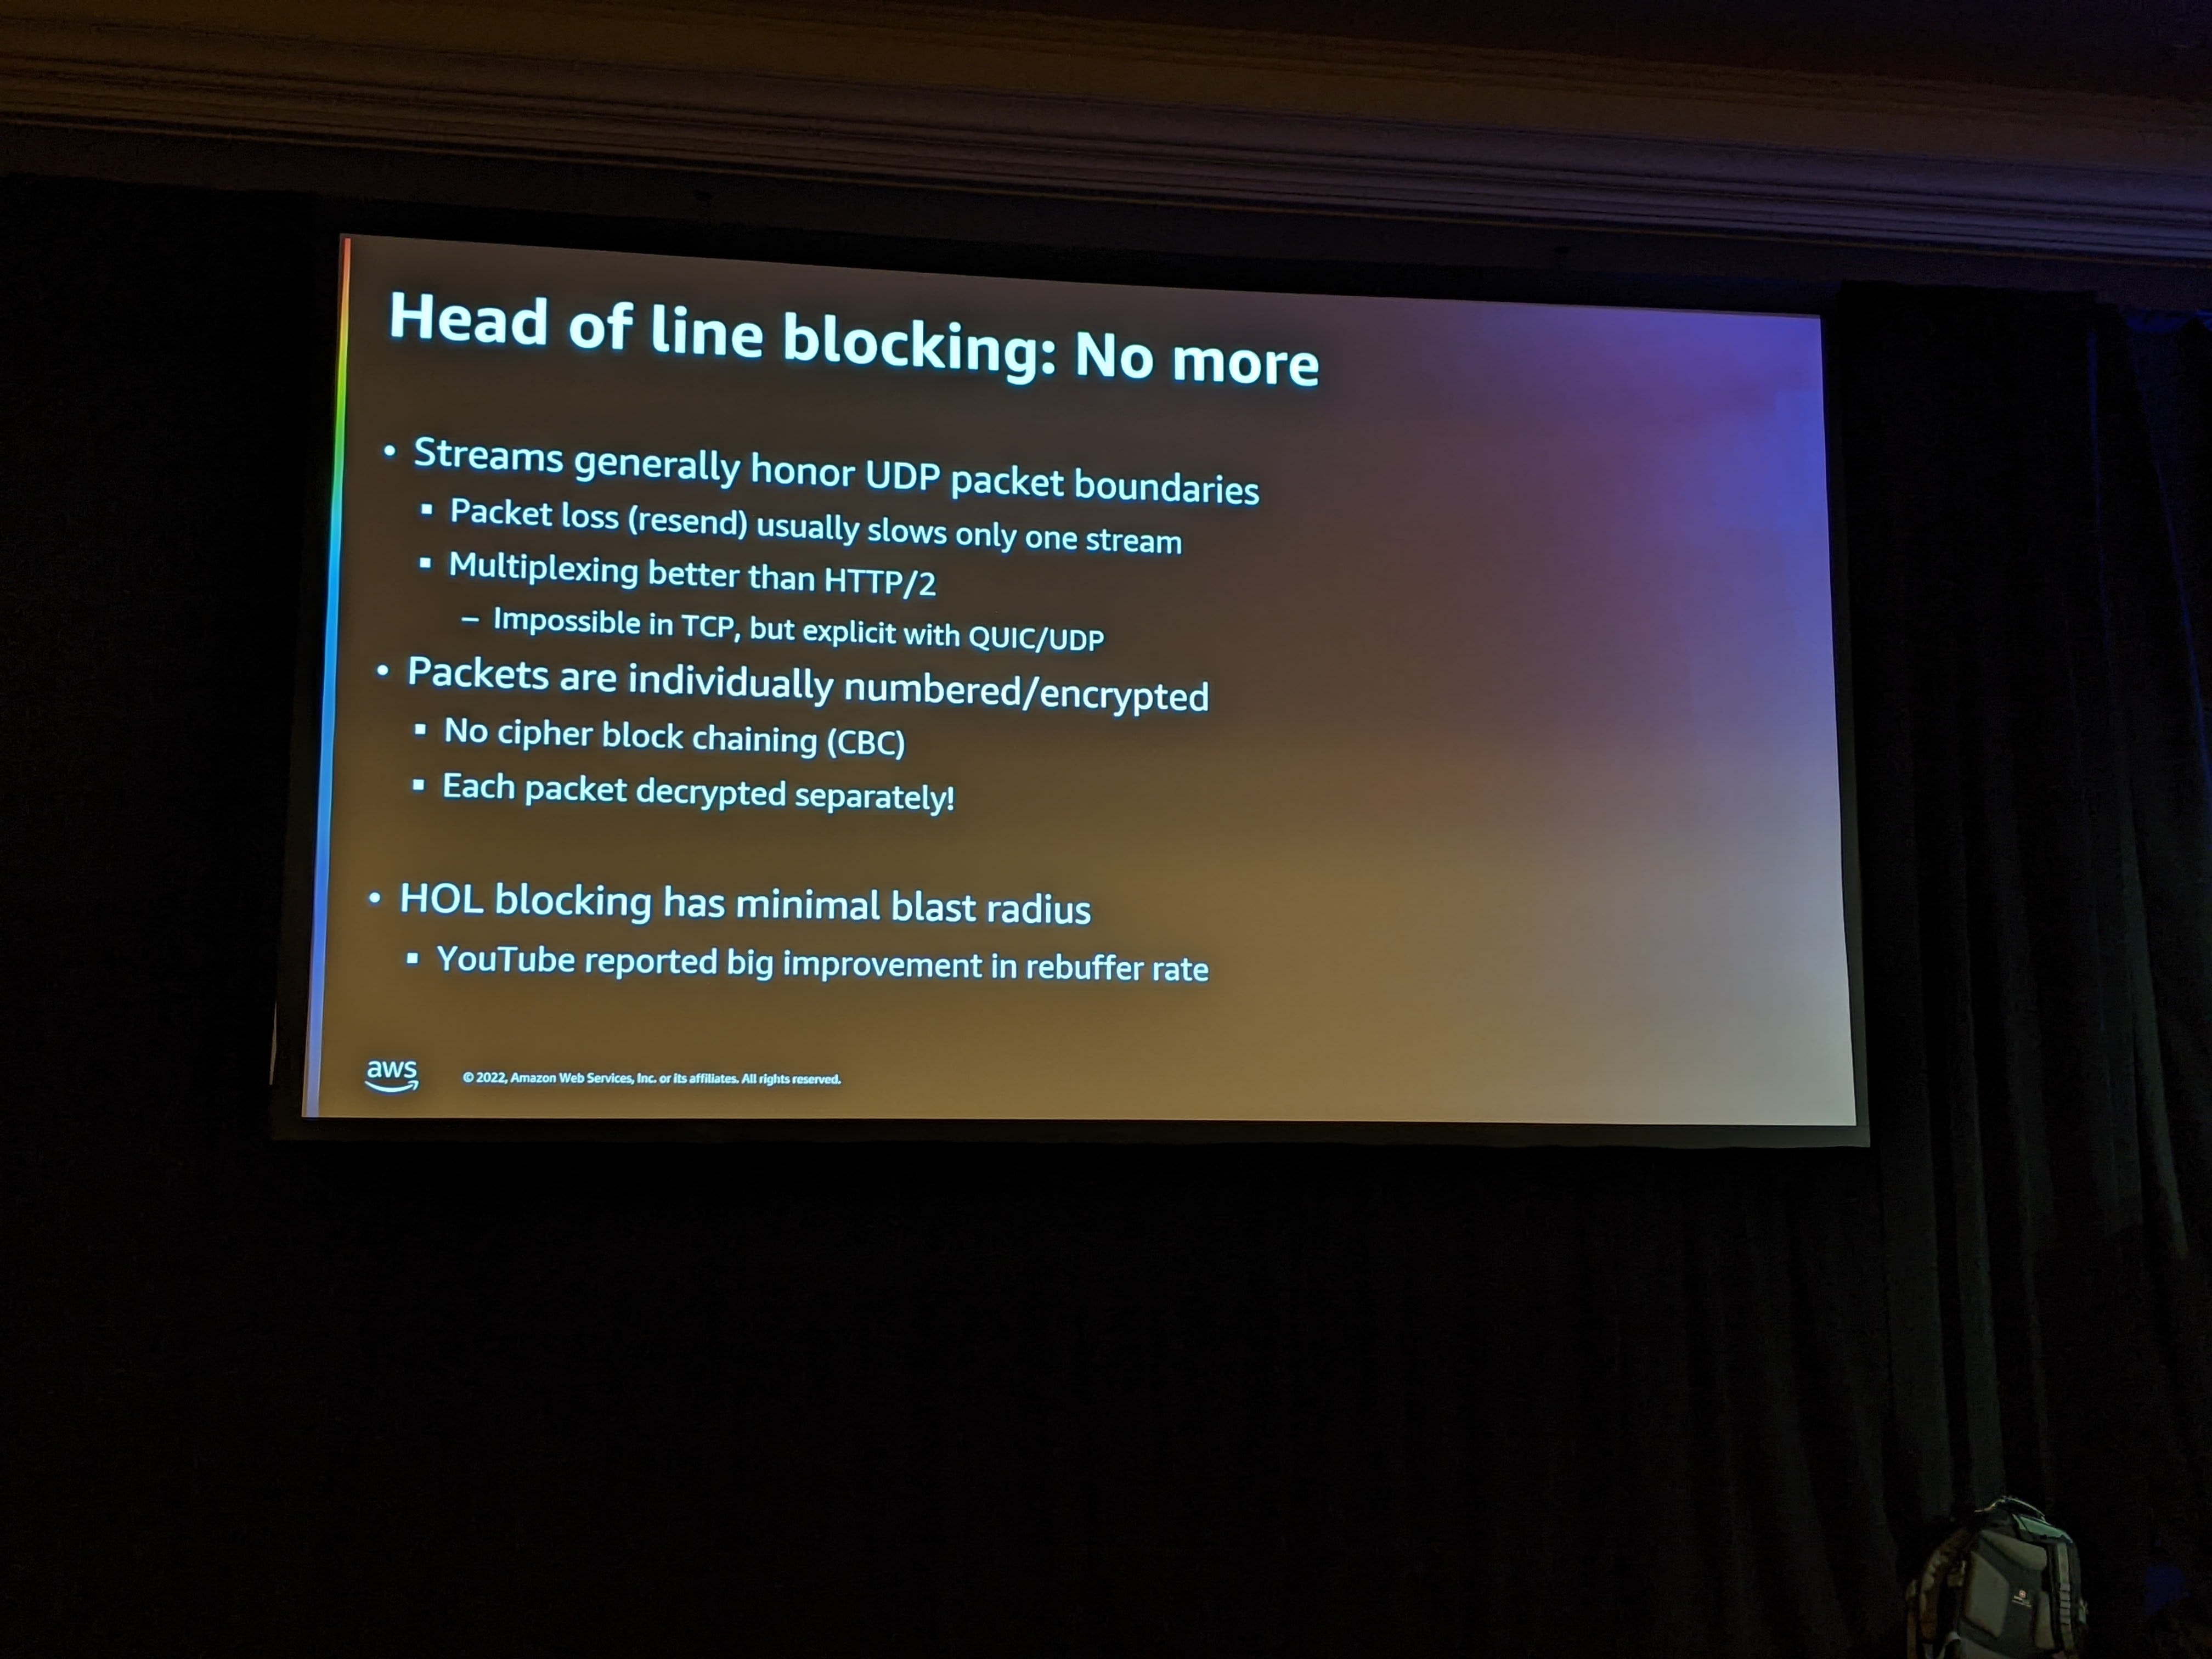
How Head of Line Blocking is prevented in QUIC
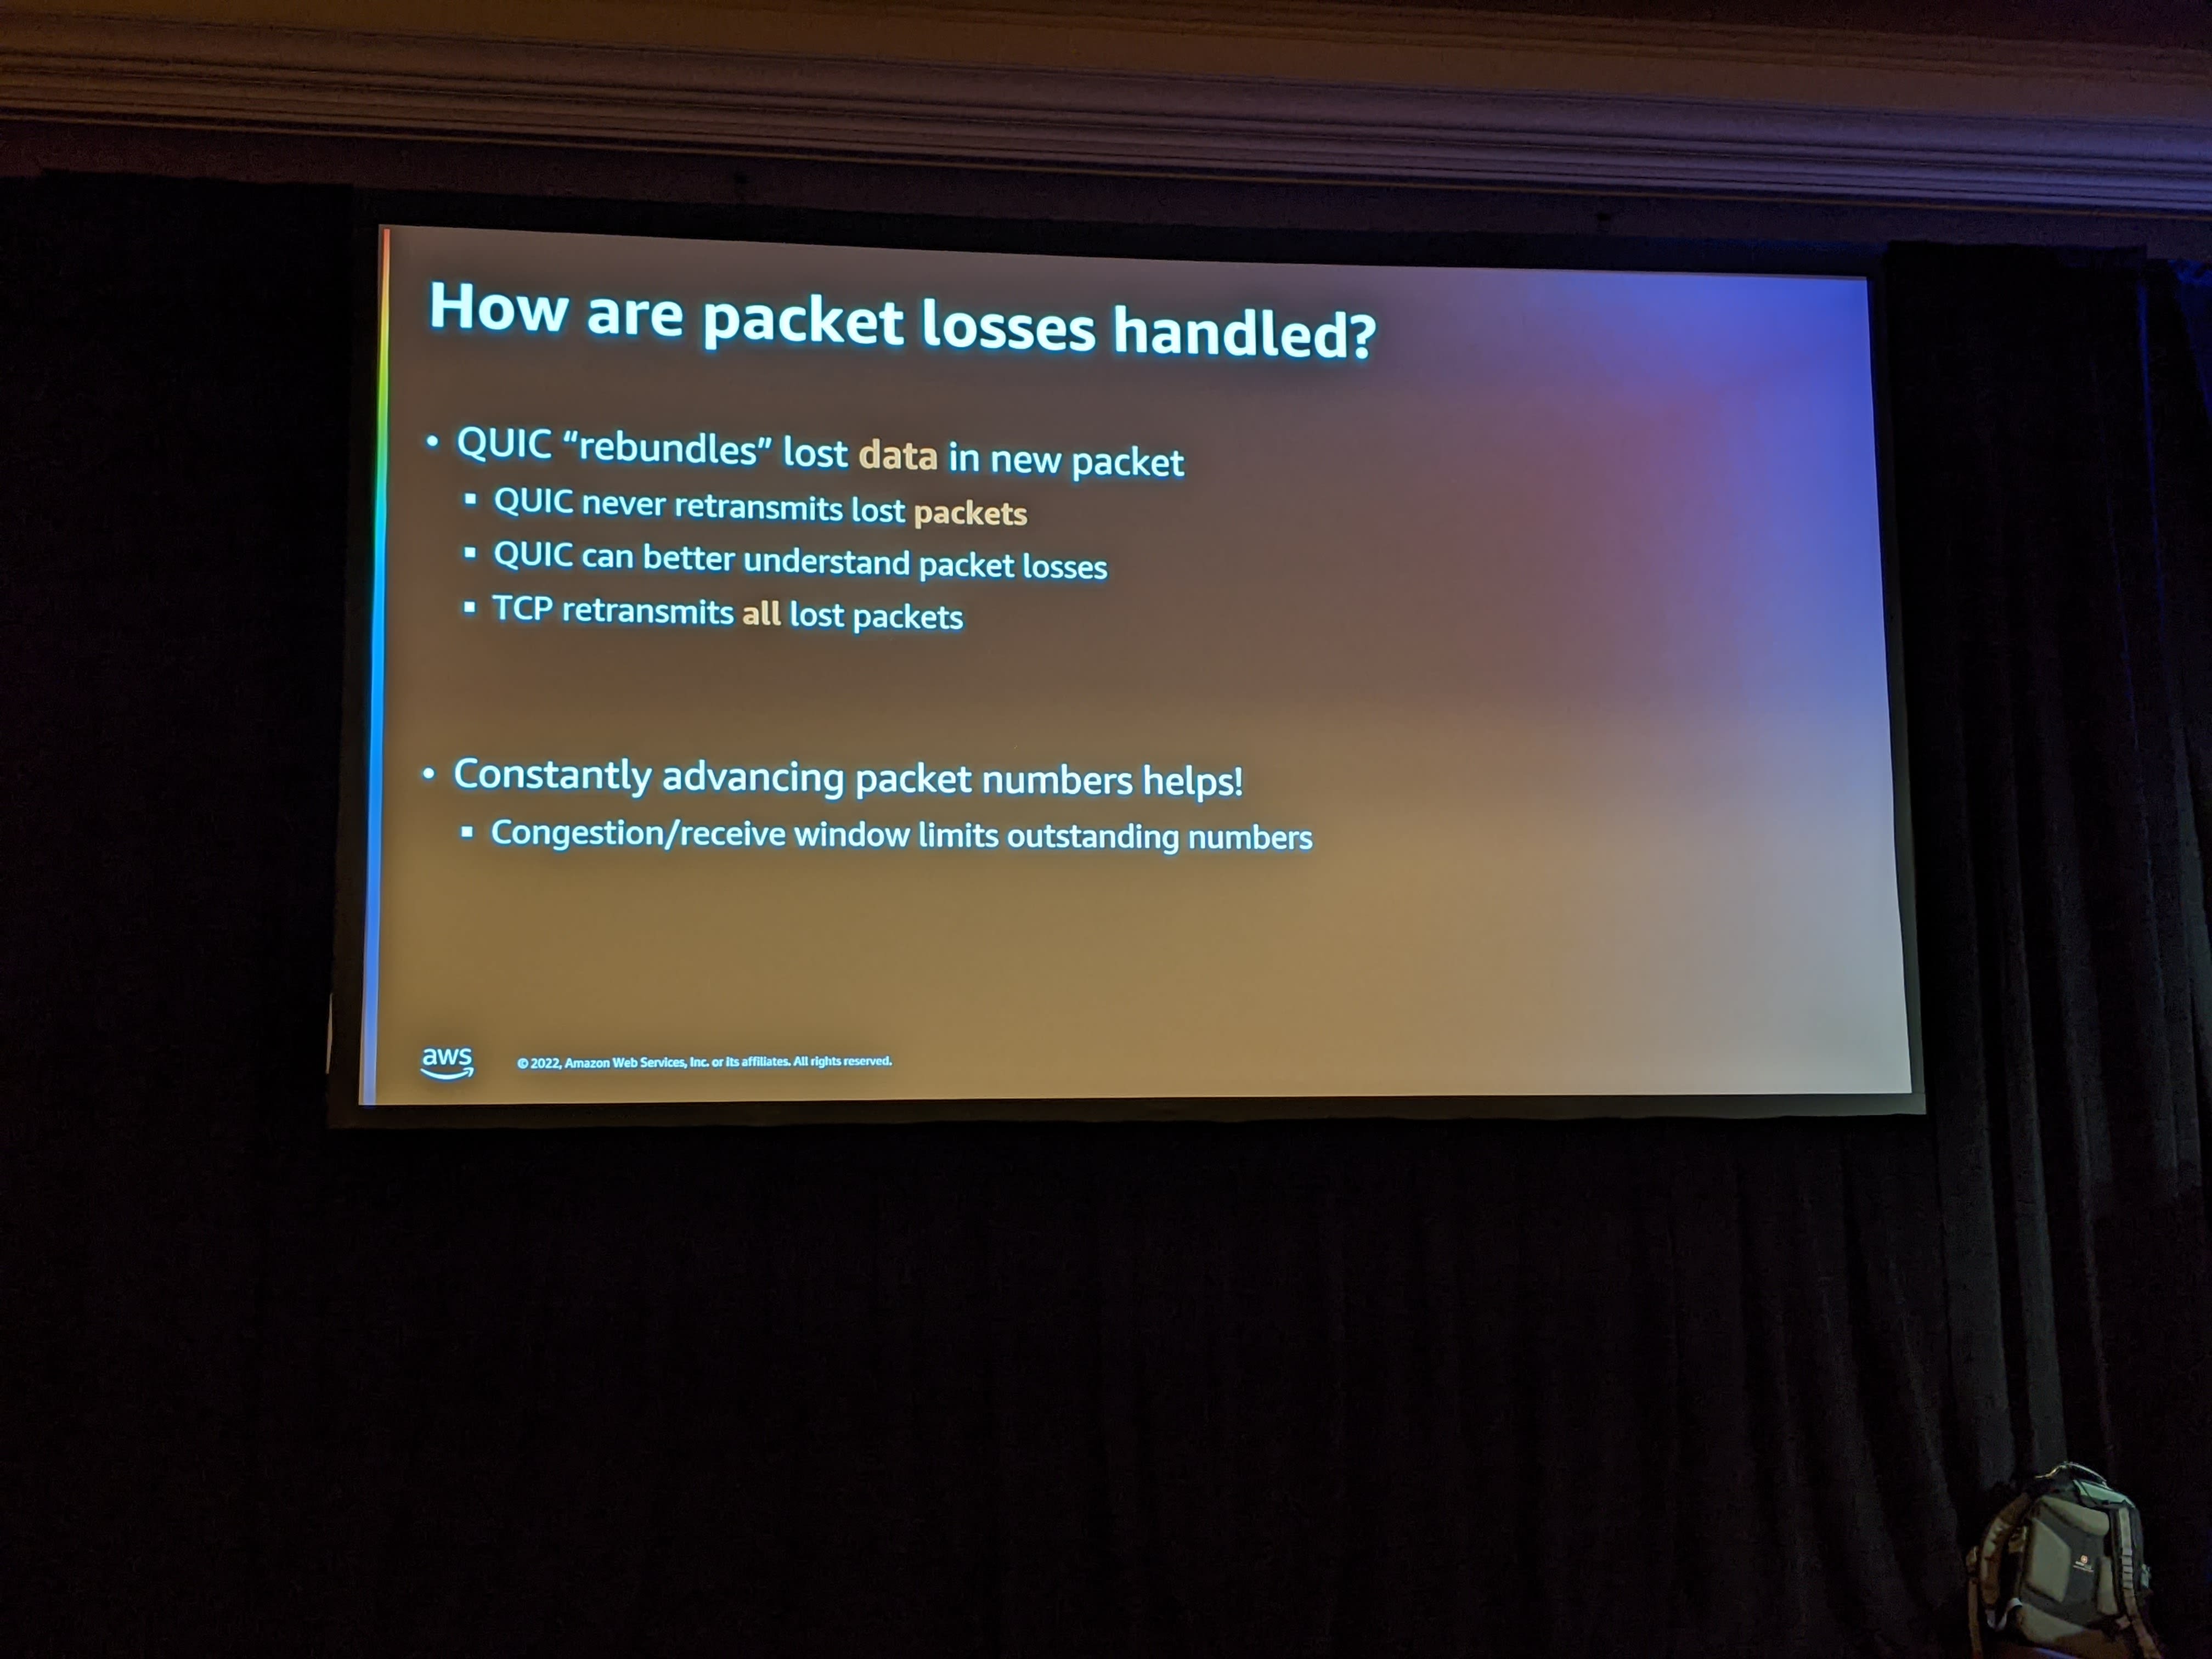
How packet loss is handled in QUIC?
Further reading: At the end of the session, Jim asked us to read a short description explaining the protocol. Here’s the document that he reference: MULTIPLEXED STREAM TRANSPORT OVER UDP.
SUS201: Detecting deforestation with geospatial images and Amazon SageMaker
This was a very interesting session related to identifying large change based on satellite images. The use case was to use the satellite image before and after a large California fire and see the impact. Unfortunately, I had a customer issue and had to walk out.
CMP314: How Stable Diffusion was built: Tips and tricks to train large models
This was a join session between Stability.ai and AWS. Stability is famous for their Stable Diffusion. One of the main speakers was Emad Mostaque, the CEO of Stability.ai. He made some very interesting observations on the development of AI.
- The whole world of large models and training was kick-started based on a paper titled Attention Is All You Need.
- Going forward, there are going to be a handful of companies that will create foundational models. This model is trained on images, videos, text, etc.
- There will be a few hundreds of companies that will build on top of the general model and train (ie fine tune) it for generic tasks on one type of data. For example, StableDiffusion for images, ChatGPT for text and so on.
- There will be thousands of companies that will use this domain specific model and train it for very specific task. For example, a car dealership company may train their model to detect dents and damages based on the images of a car.
The second half of the talk was very deep architecture discussion on how StableDiffusion managed to create Super Computer like raw power using AWS Parallel Cluster.
Some of the fun launch information were:
- Stable diffusion now does hands :-)
- Photorealism is now almost here. By next year, we should have the generative AI build the capability for photographer like quality.
Created by StableDiffusion with the prompt “Artificial Intelligence looking like a divine being’:

AMZ302: How Amazon uses better metrics for improved website performance
This was a second session by Jim Roskind that I attended at re:Invent. This was focused on performance testing. Although the focus was measuring and improving latency, I think the lessons hold true for most of the other perf metrics that we cover.
Why current measurements are broken?
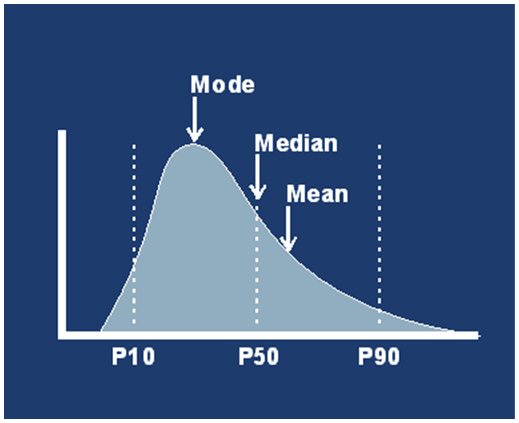
According to Jim, in the current model, people tend to use different percentiles for measuring performance. The expectation is the the performance distribution is something like this.
However, when everybody knows that the metrics being tracked are p50, p90 and p95, the distribution in one organization became something like this.
When a measure becomes a target, it ceases to be a good measure. - Goodheart’s Law
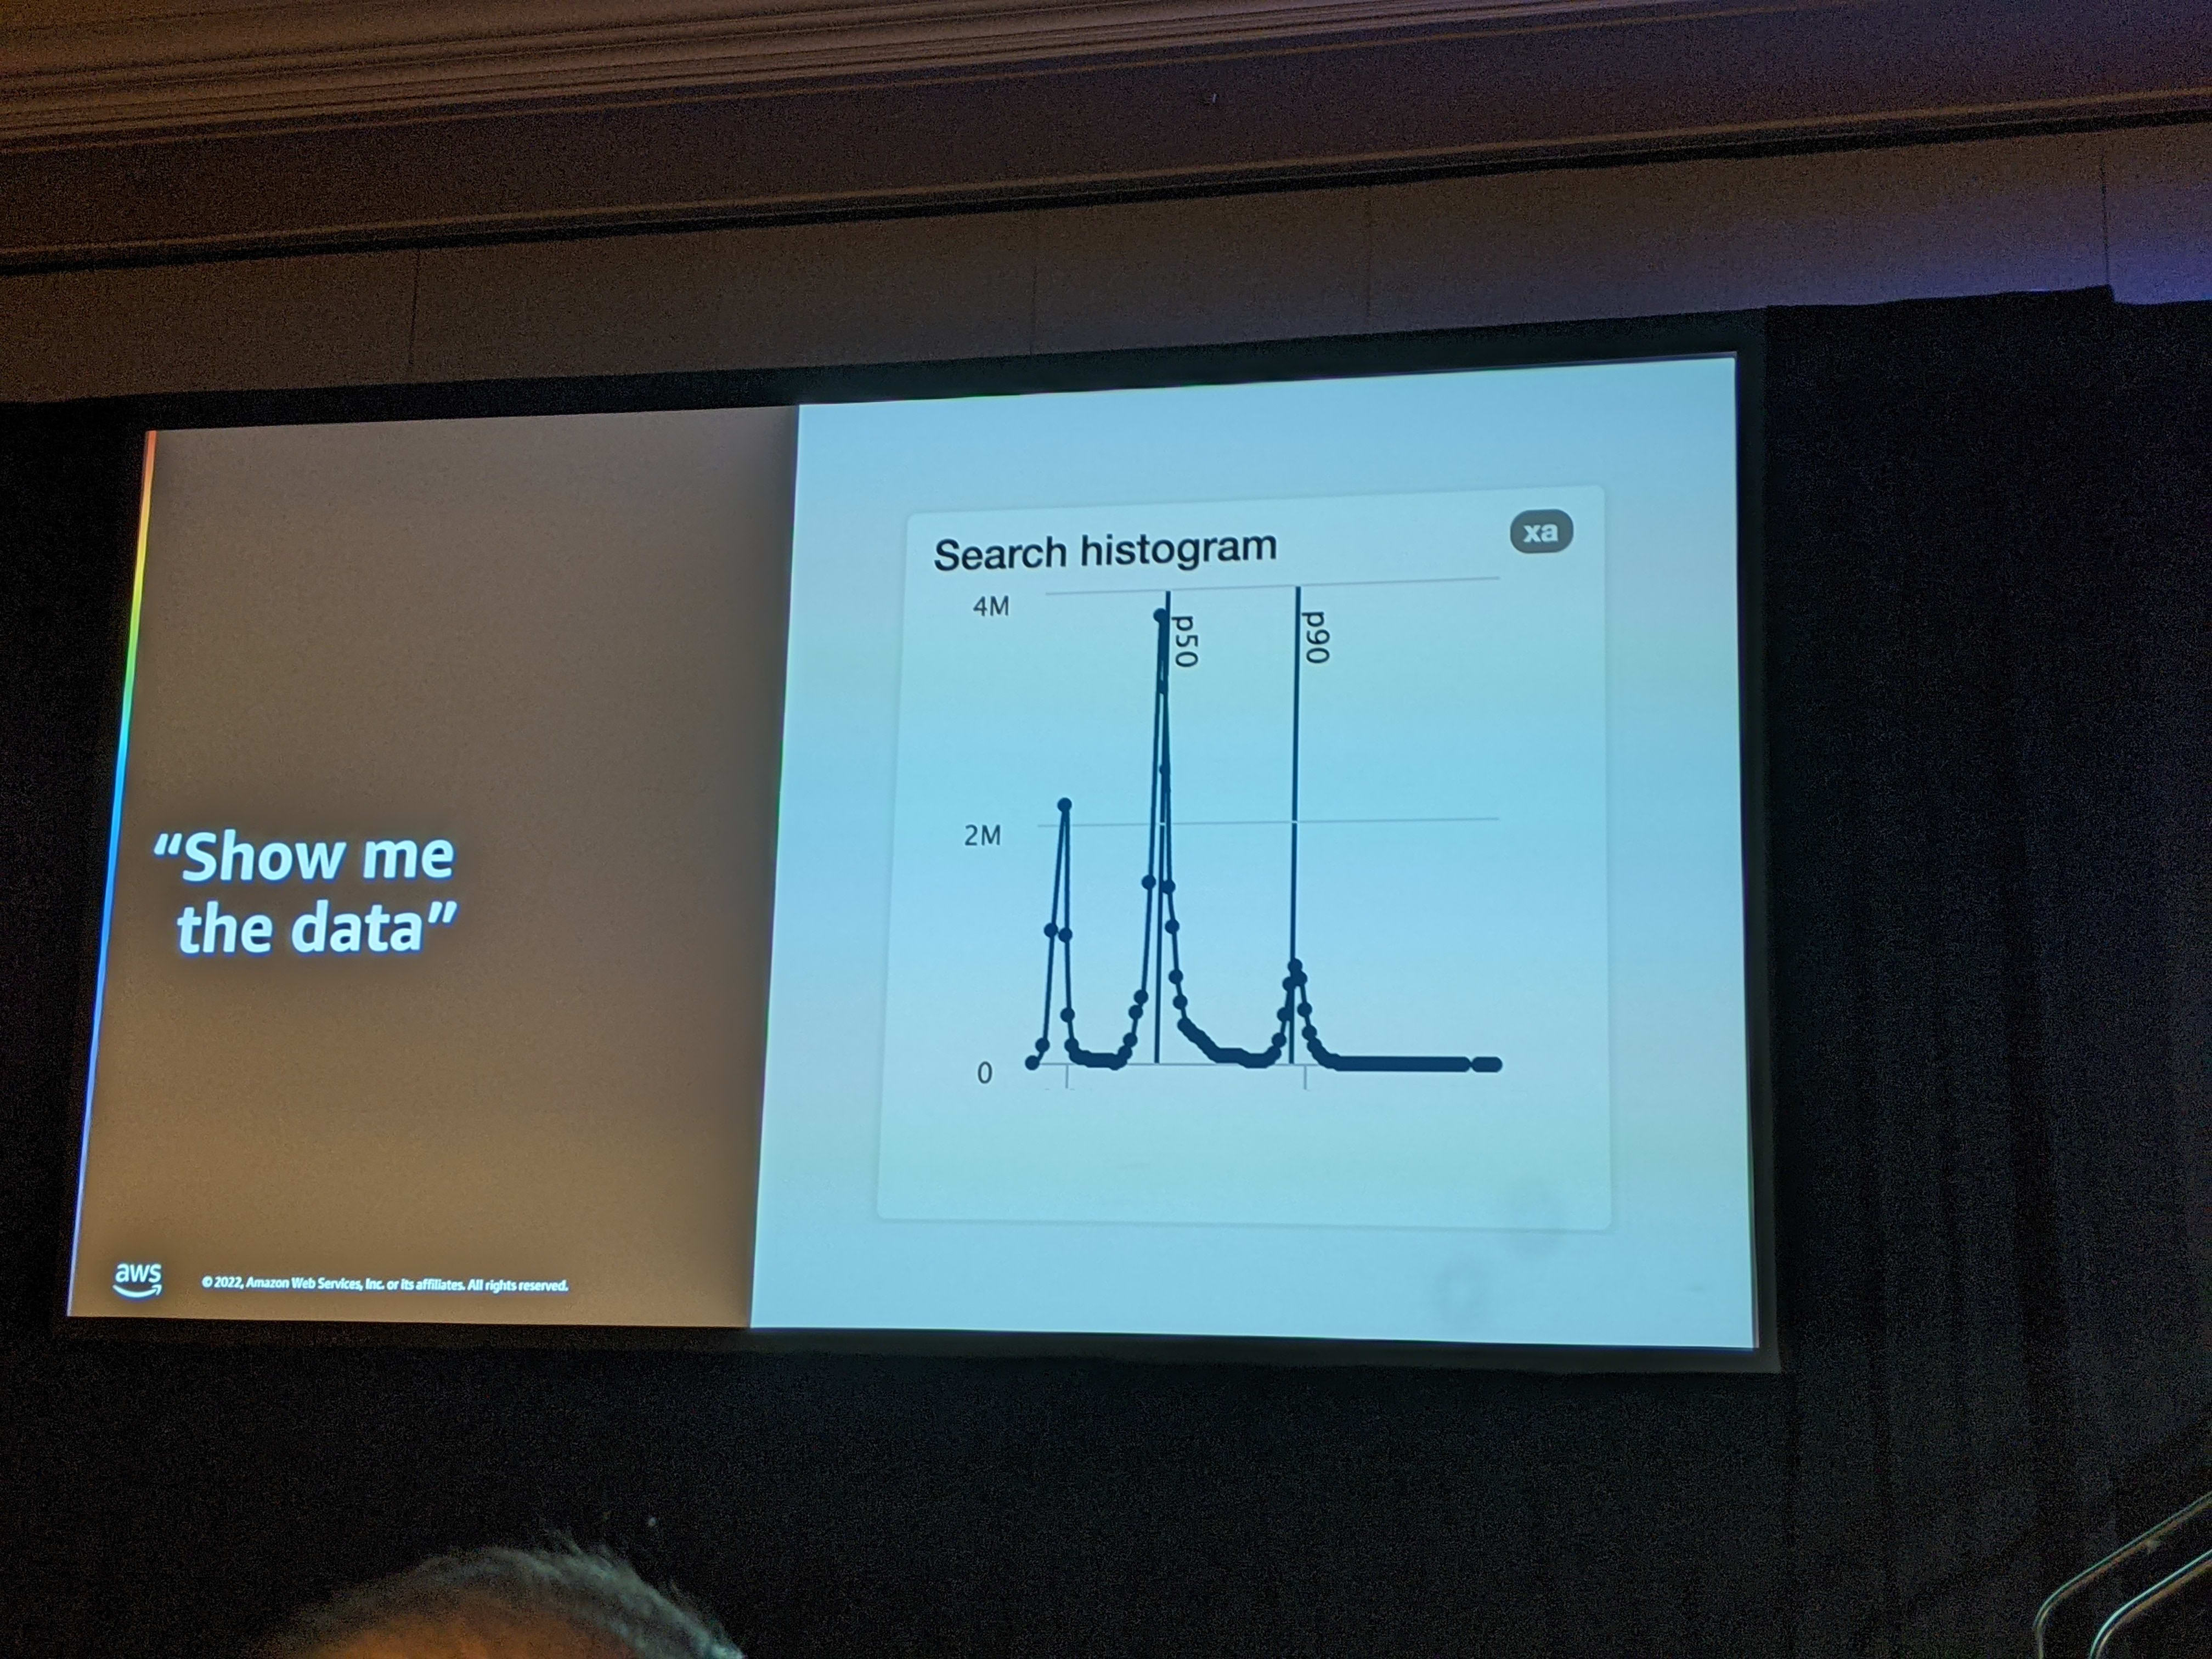
So from a measurement perspective, nothing had changed. However, for real users, the performance had degraded. Jim called such measurements as fenceposts. Imagine each percentile is like a fence. Between 2 measures is a lot of free land where sheep can graze. In an ideal world, the fence are supposed to graze all over the free space between the fence. However, when this kind of measurement is used, it is similar to the sheep collecting together near the fence. So this presents 2 kinds of major issues:
- no initiative to fix if within target..
- no difference in how bad “bad” is ..
Jim’s Solution - Trimmed Mean
The suggestion from Jim and team was that we should start to consider the Trimmed Mean as a better metric.
A trimmed mean is a method of finding a more realistic average value by getting rid of certain erratic observations. Under this method, a percentage of highest and lowest values are cut out from both the extremes before calculating the mean. This pre-calculation elimination results in a more reliable mean value. Source
Here’s a simple calculation from the WallStreetMojo site:

In the past, mean (i.e. average) was considered a bad metric because the outliers could have extremely high impact. By using trimmed mean, we discard these outliers and then count everything to find out an average number. The advantages are:
- it is a single number.
- once the percentile to be discarded is fixed, this metric will include all measurements.
- is is impacted by each measure and will not blind to “fencing” effect described earlier.
By adopting a trimmed mean 90 (tm90) metric, Amazon was able to improve its webpage latencies.
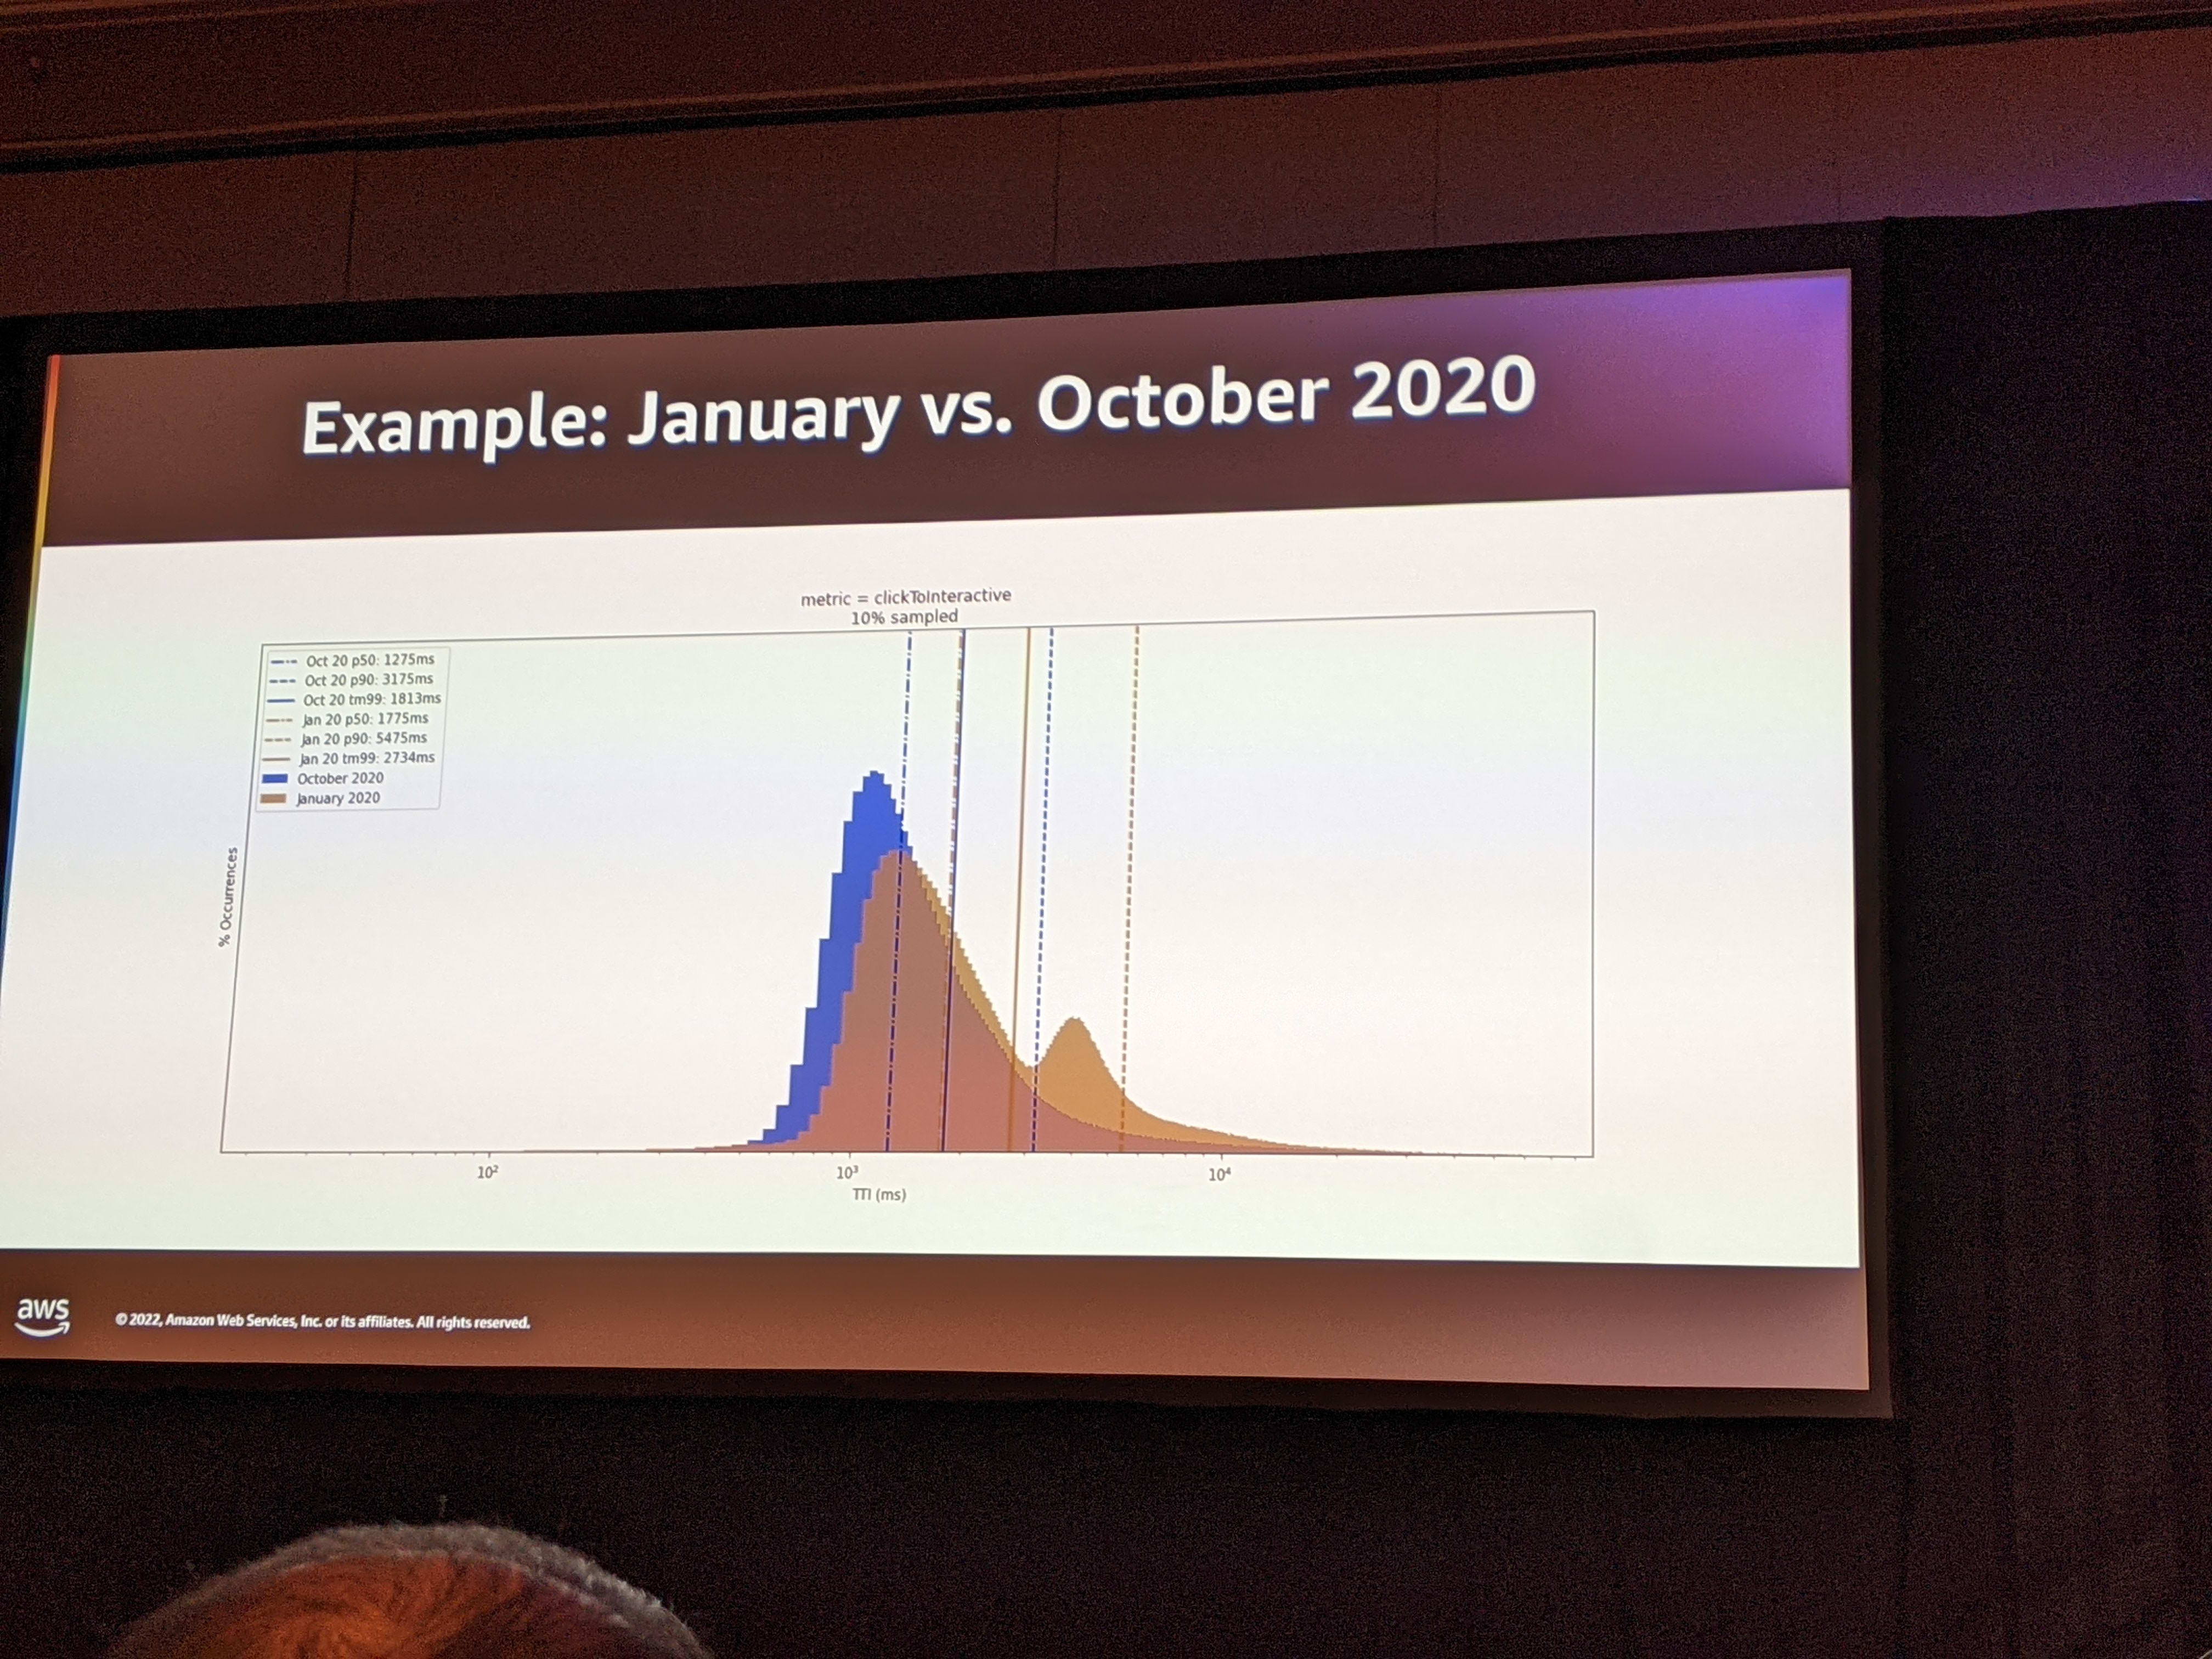
After Jim’s talk, other AWS architects presented the Cloudwatch metrics and showed the ways to generate this metric from the data. They also informed us that Cloudwatch RUM is a solution and that can be used for real user monitoring.
AIM342 Advancing Responsible AI: Bias Assessment and Transparency
Peter Hallinan Sr Manager AI and Dr. Alicia Sagae Research Scientist, AI
This workshop was aimed at helping generate a discussion around the potential for bias in AI and the mechanism to bubble it up and communicate it. In traditional software development, we always try our best to articulate the requirements, assumptions and scope. In AI projects, this has not necessarily been done. One of the take-aways was to figure out a way to create a process to explain and communicate the assumptions.
The starting point was a walk through on the concepts of equality and equity.
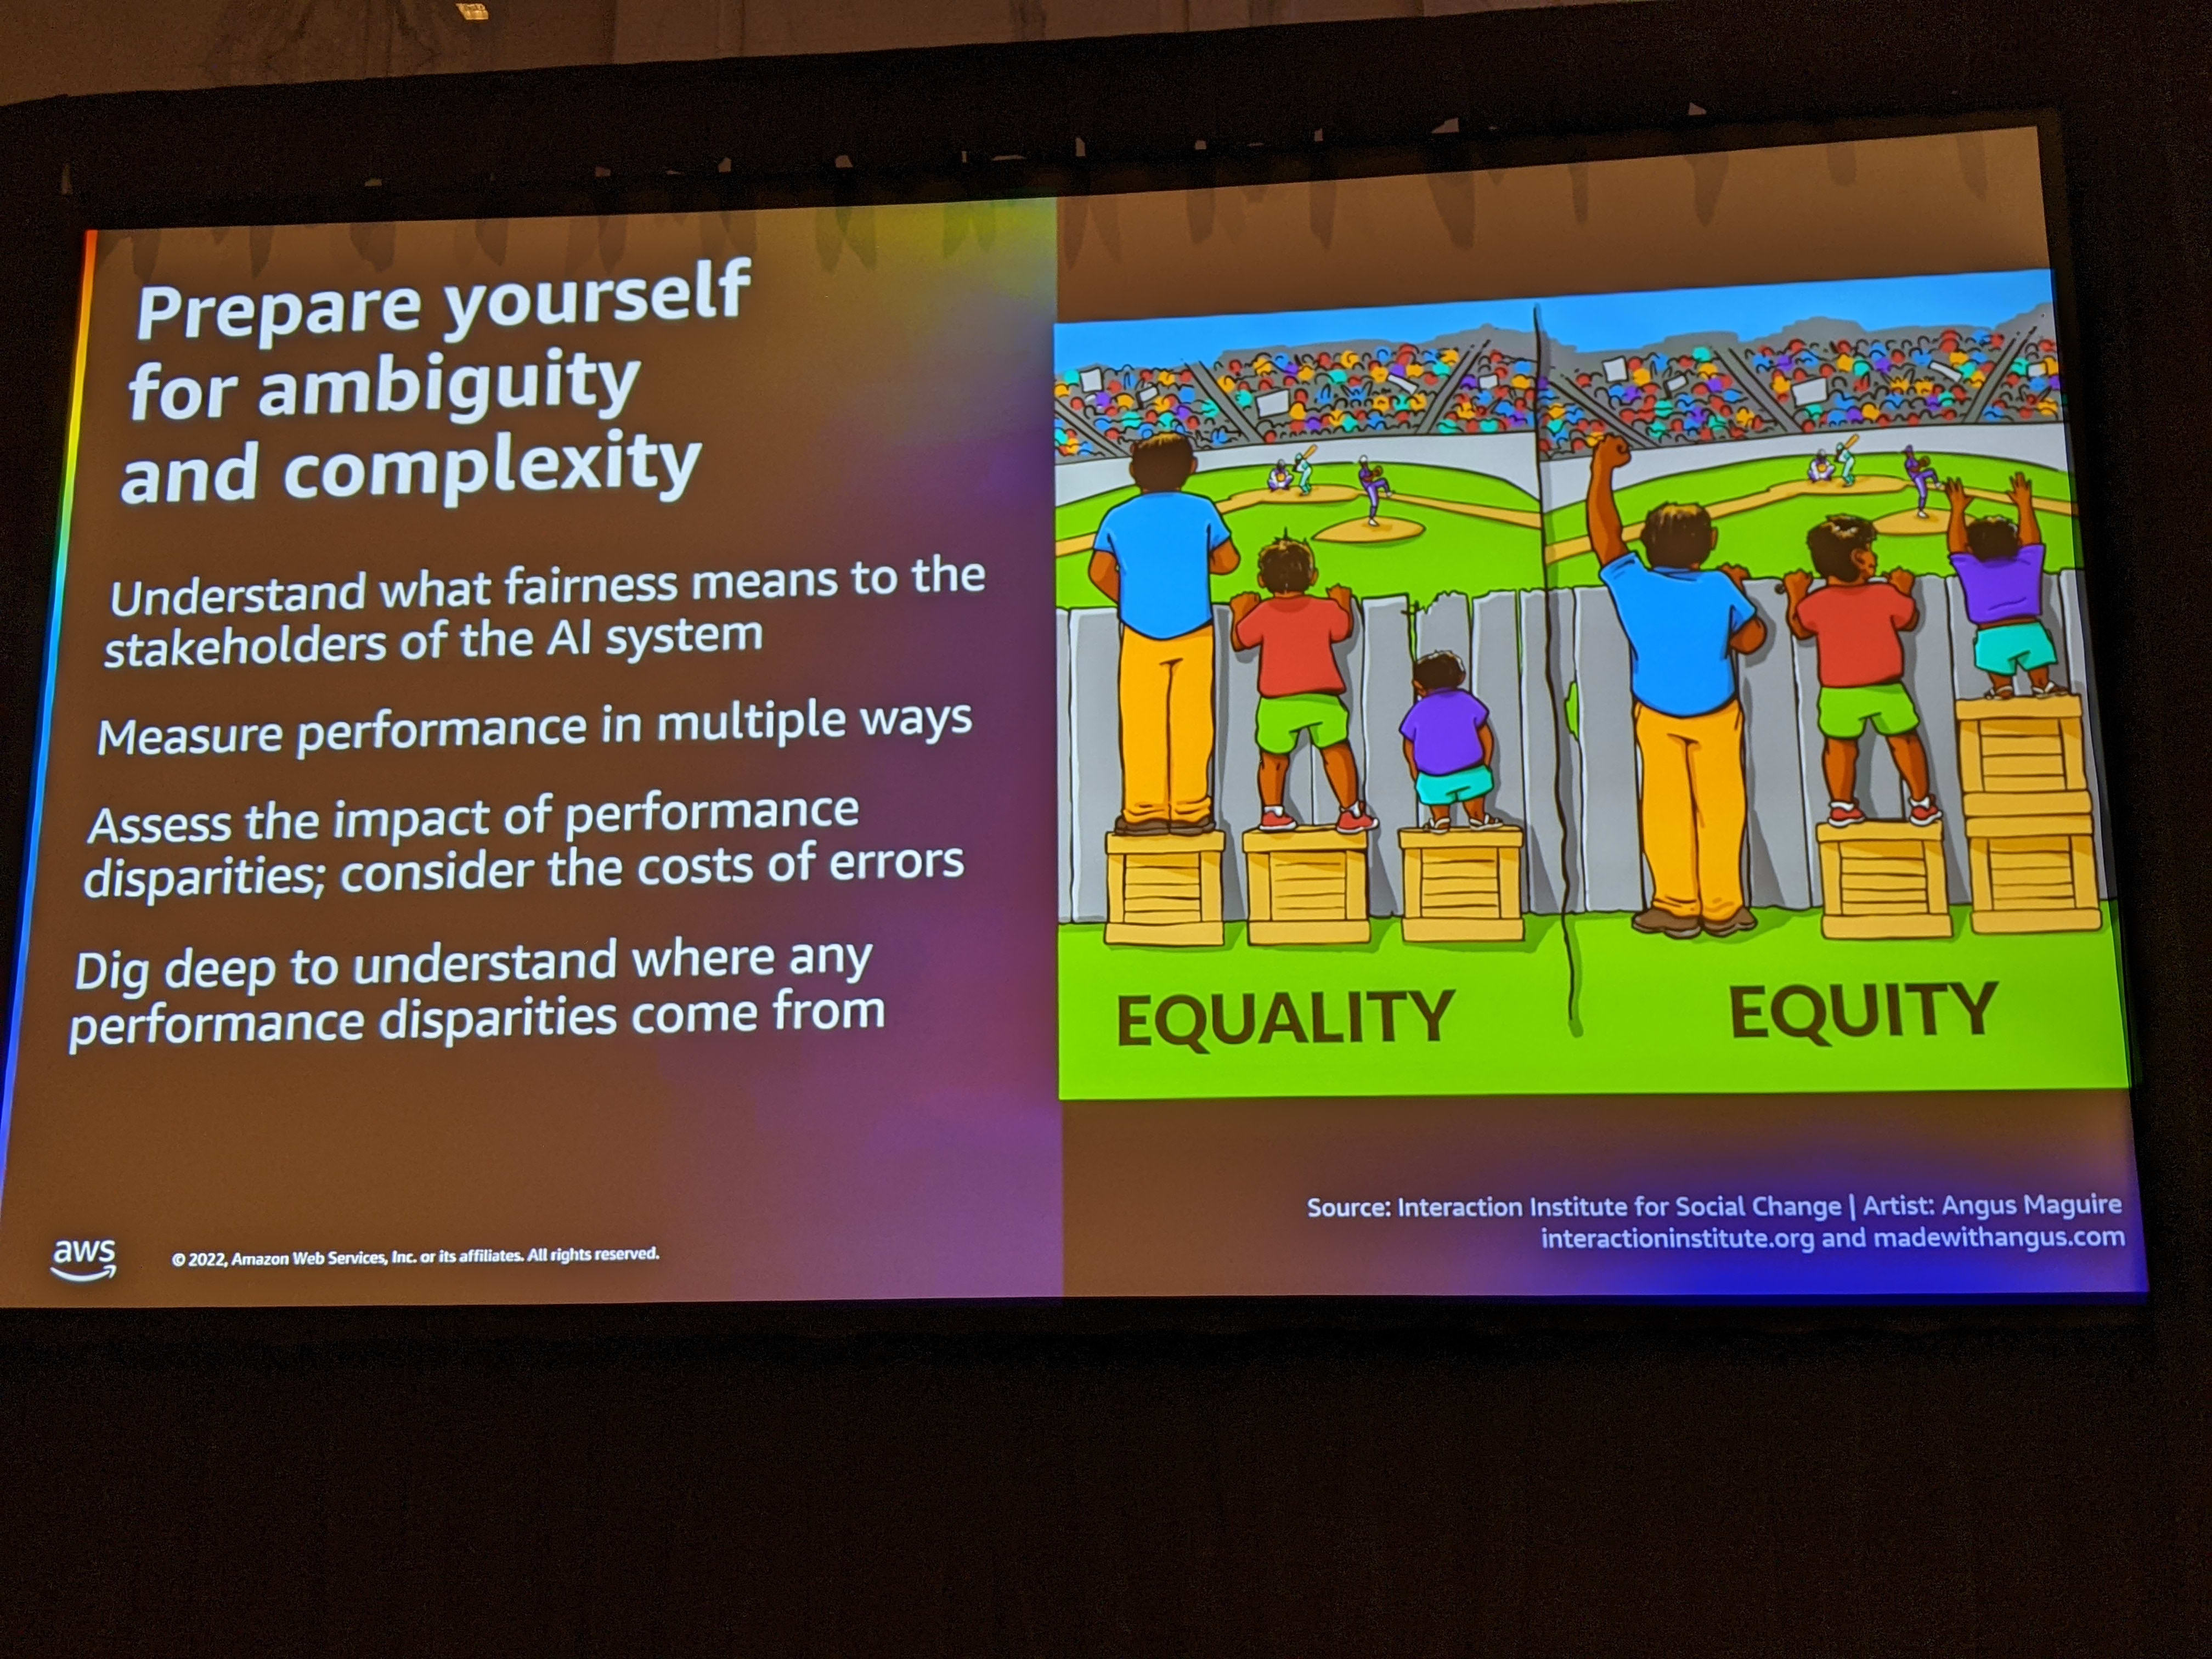
The hands-on workshop aimed to help us identify if there are any unwanted bias in our AI system.
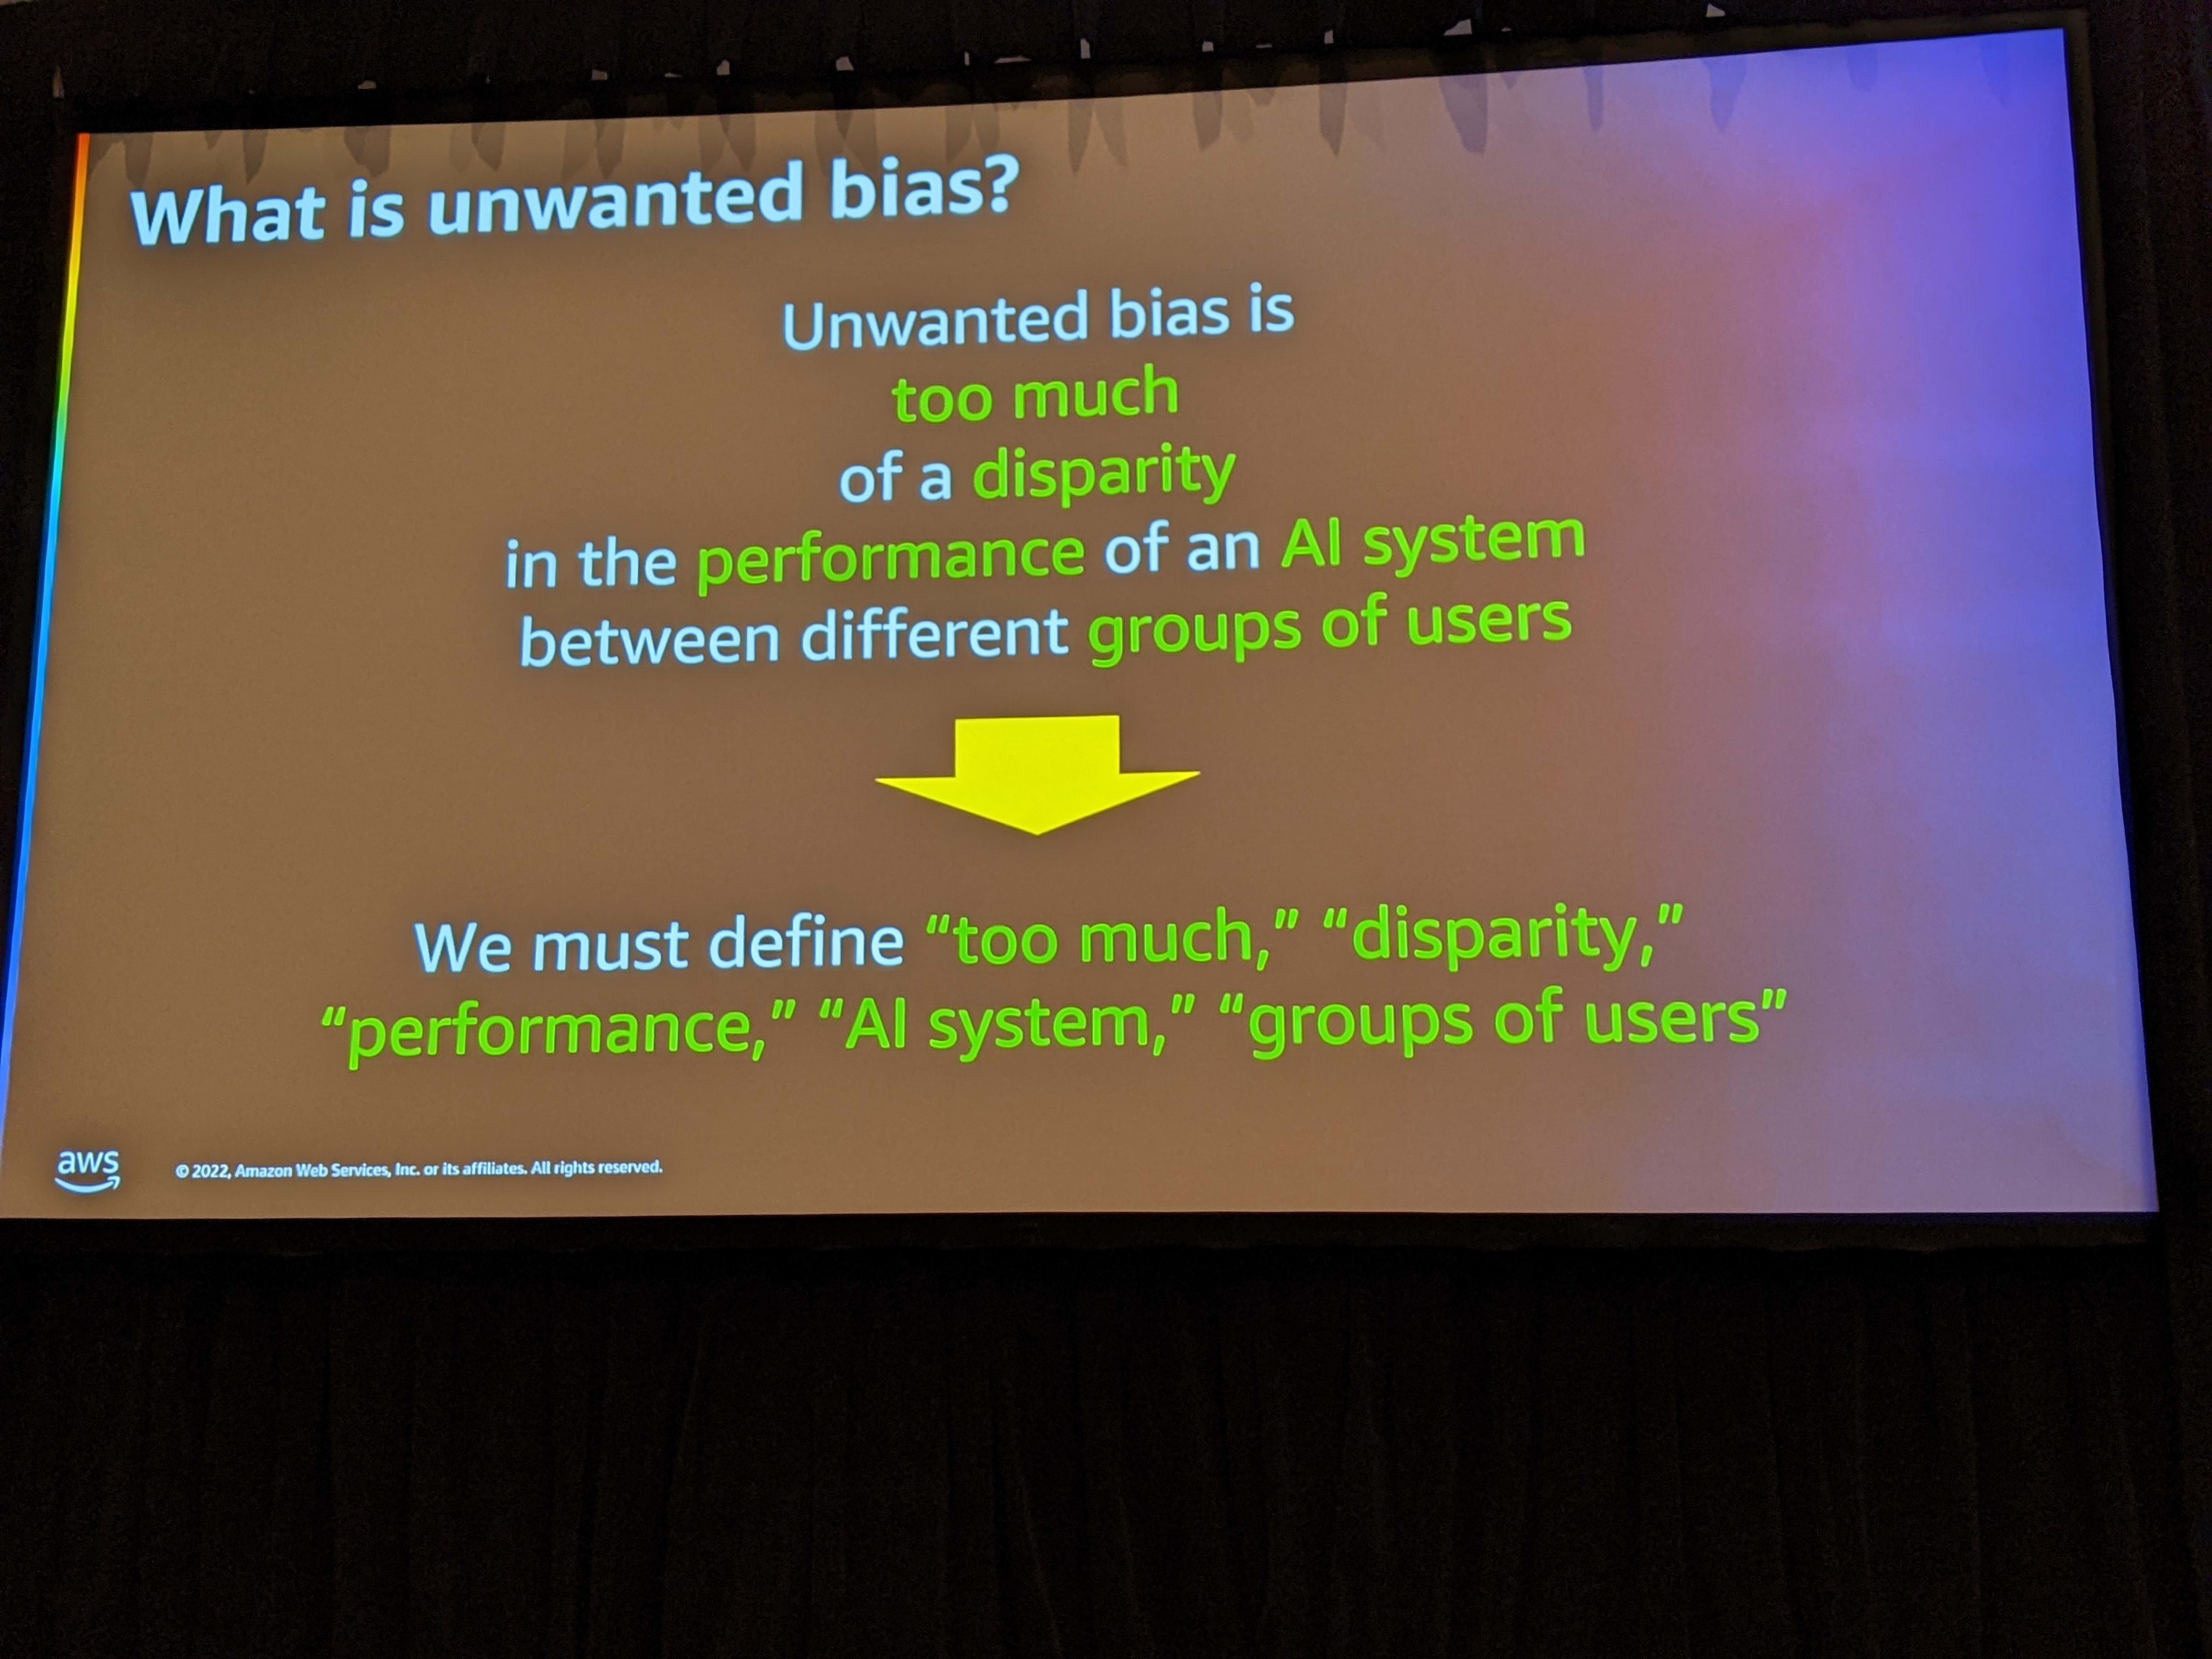
During the workshop, we used a simple Python notebook. Using the modified MNIST number recognition program we did the following:
- Calculate the confusion metrics for number recognition. We thought it was pretty good since accuracy was over 80%.
- When we broke it down, we realized the accuracy for specific numbers was much lower (~50%).
- We had discussion at this point on what it would mean in real world. Suppose number recognition is go/no-go on mortgages. One group would be disproportionately be rejected.
- The next step was to identify the number of samples and identify if there were patterns. The numbers that had a lower accuracy had lower training samples. We then discussed if additional training samples would improve the accuracy.
- We then explored adding an additional dimension of color and then running the accuracy comparison based on multiple parameters like the type of digit (curved, linear) and color (orange, red).
We closed it out with a few pointers on taking this discussion outside of the session.
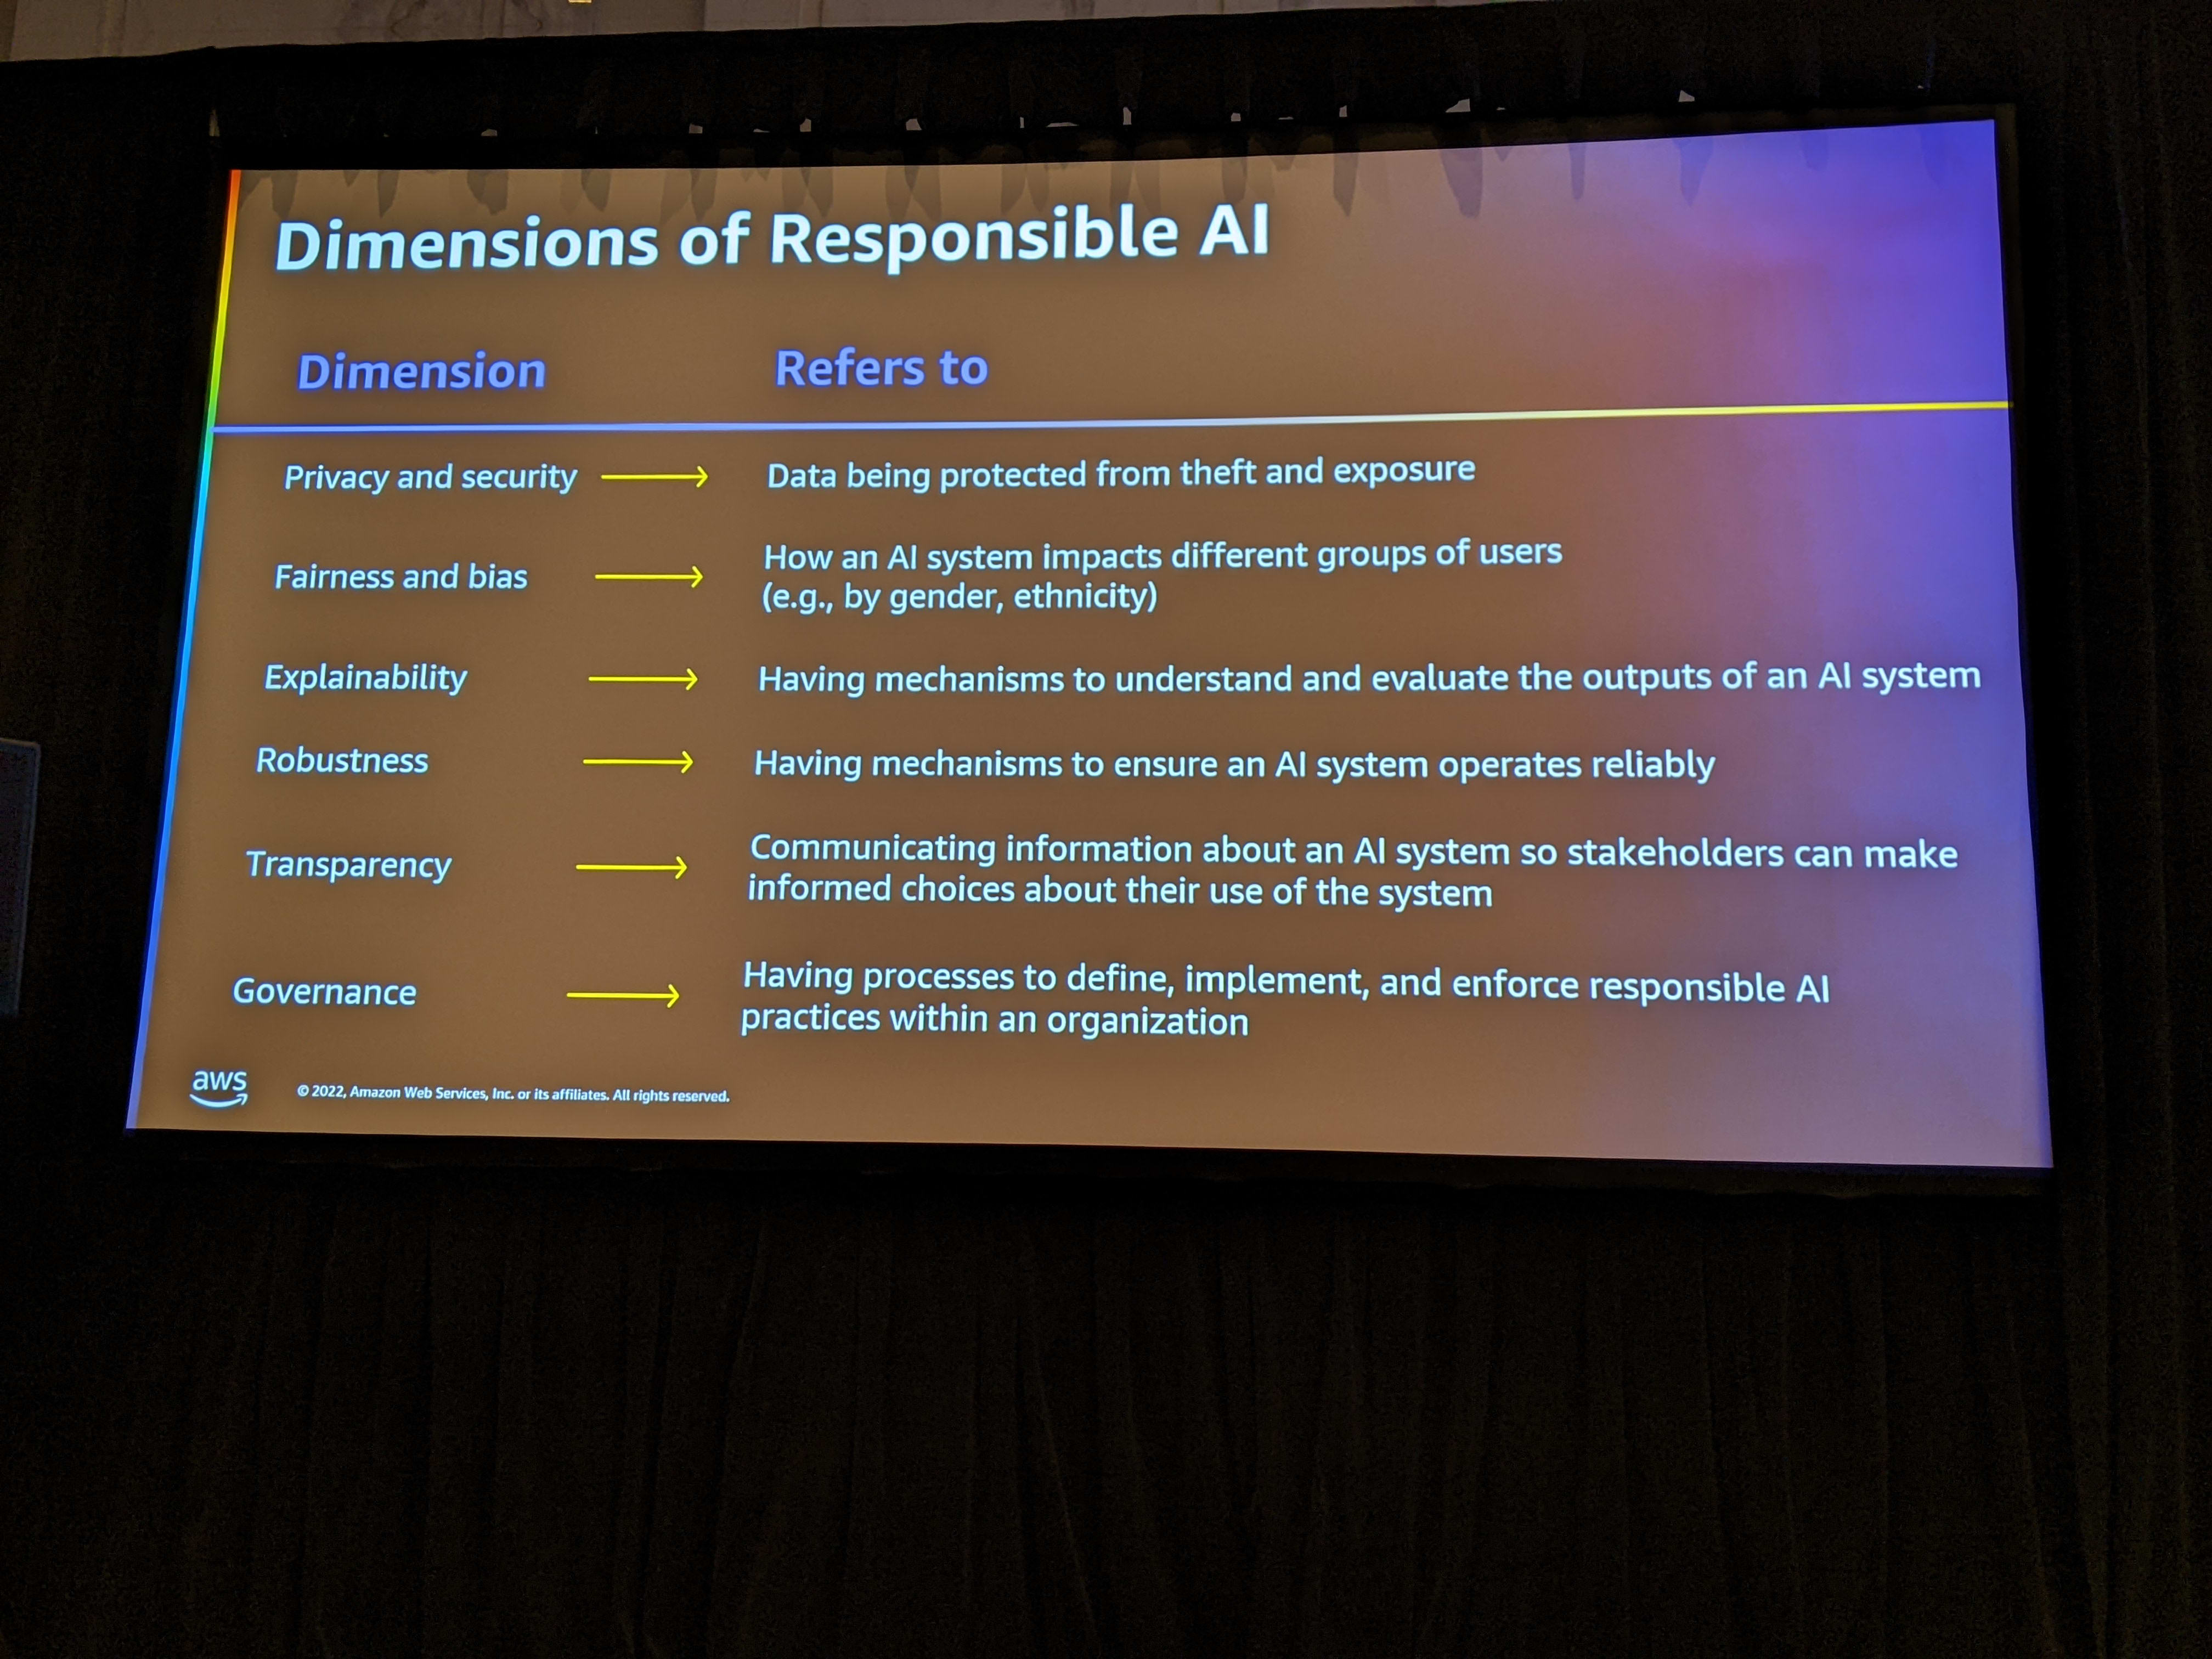
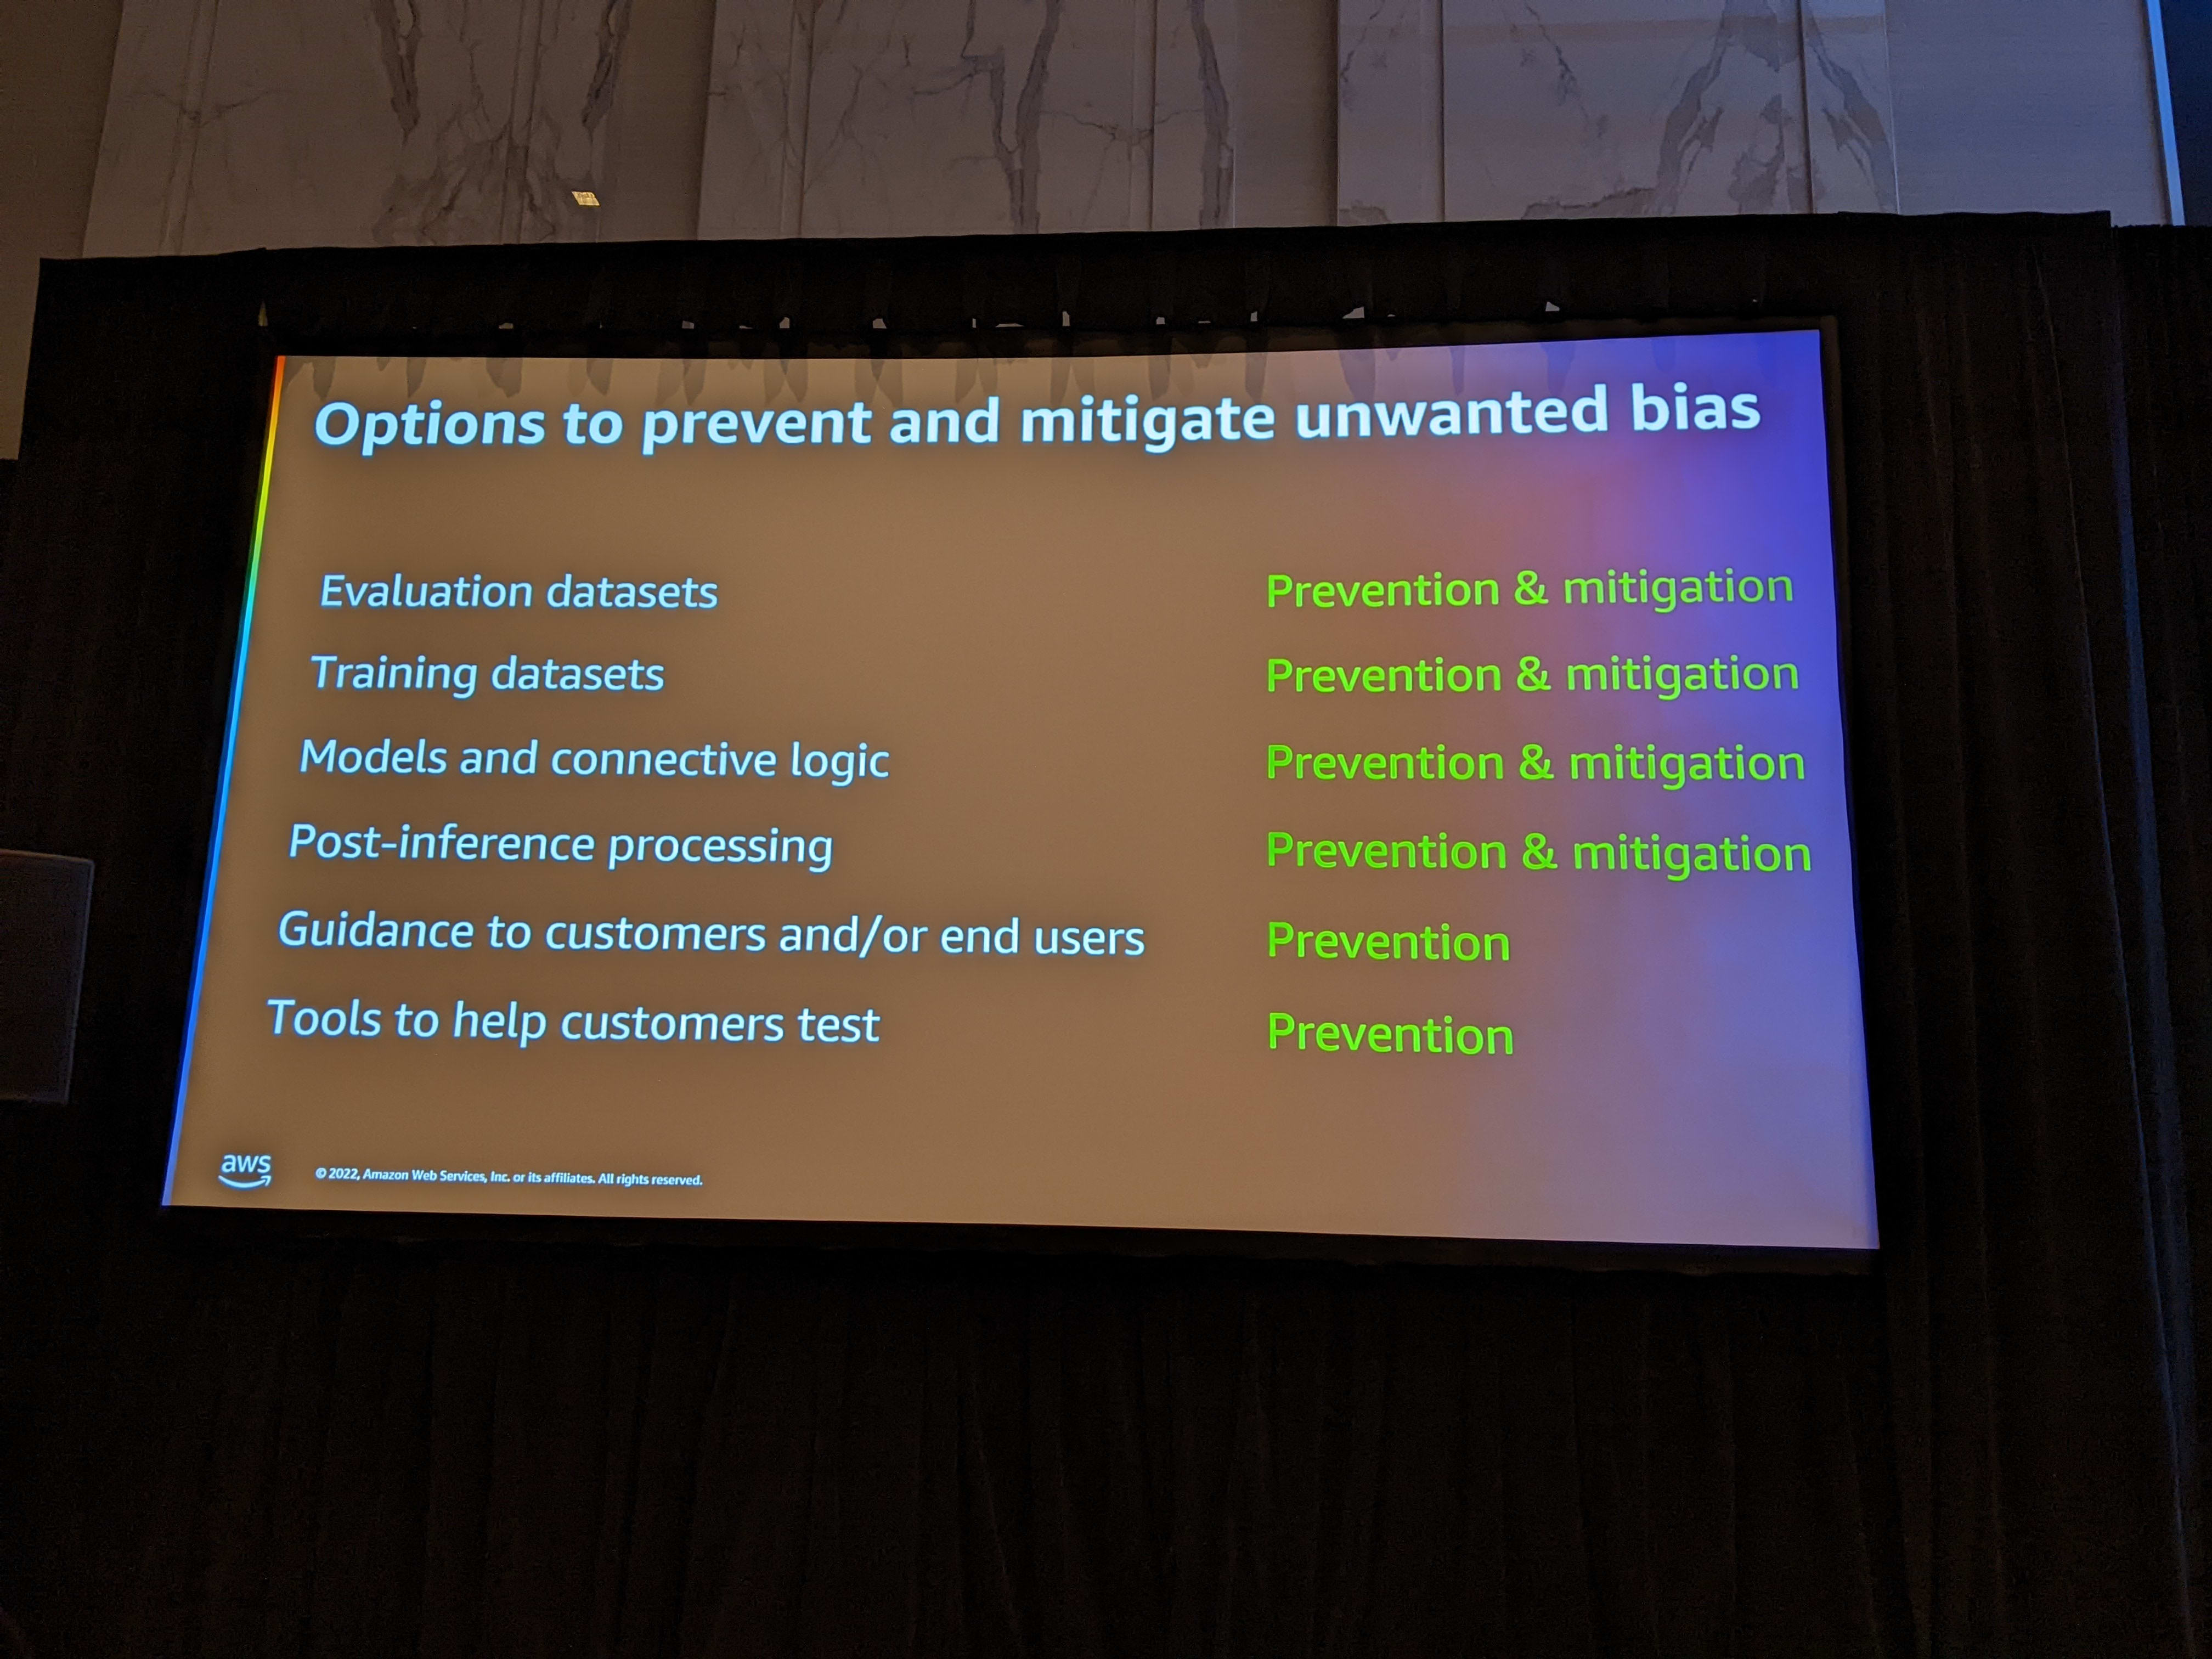
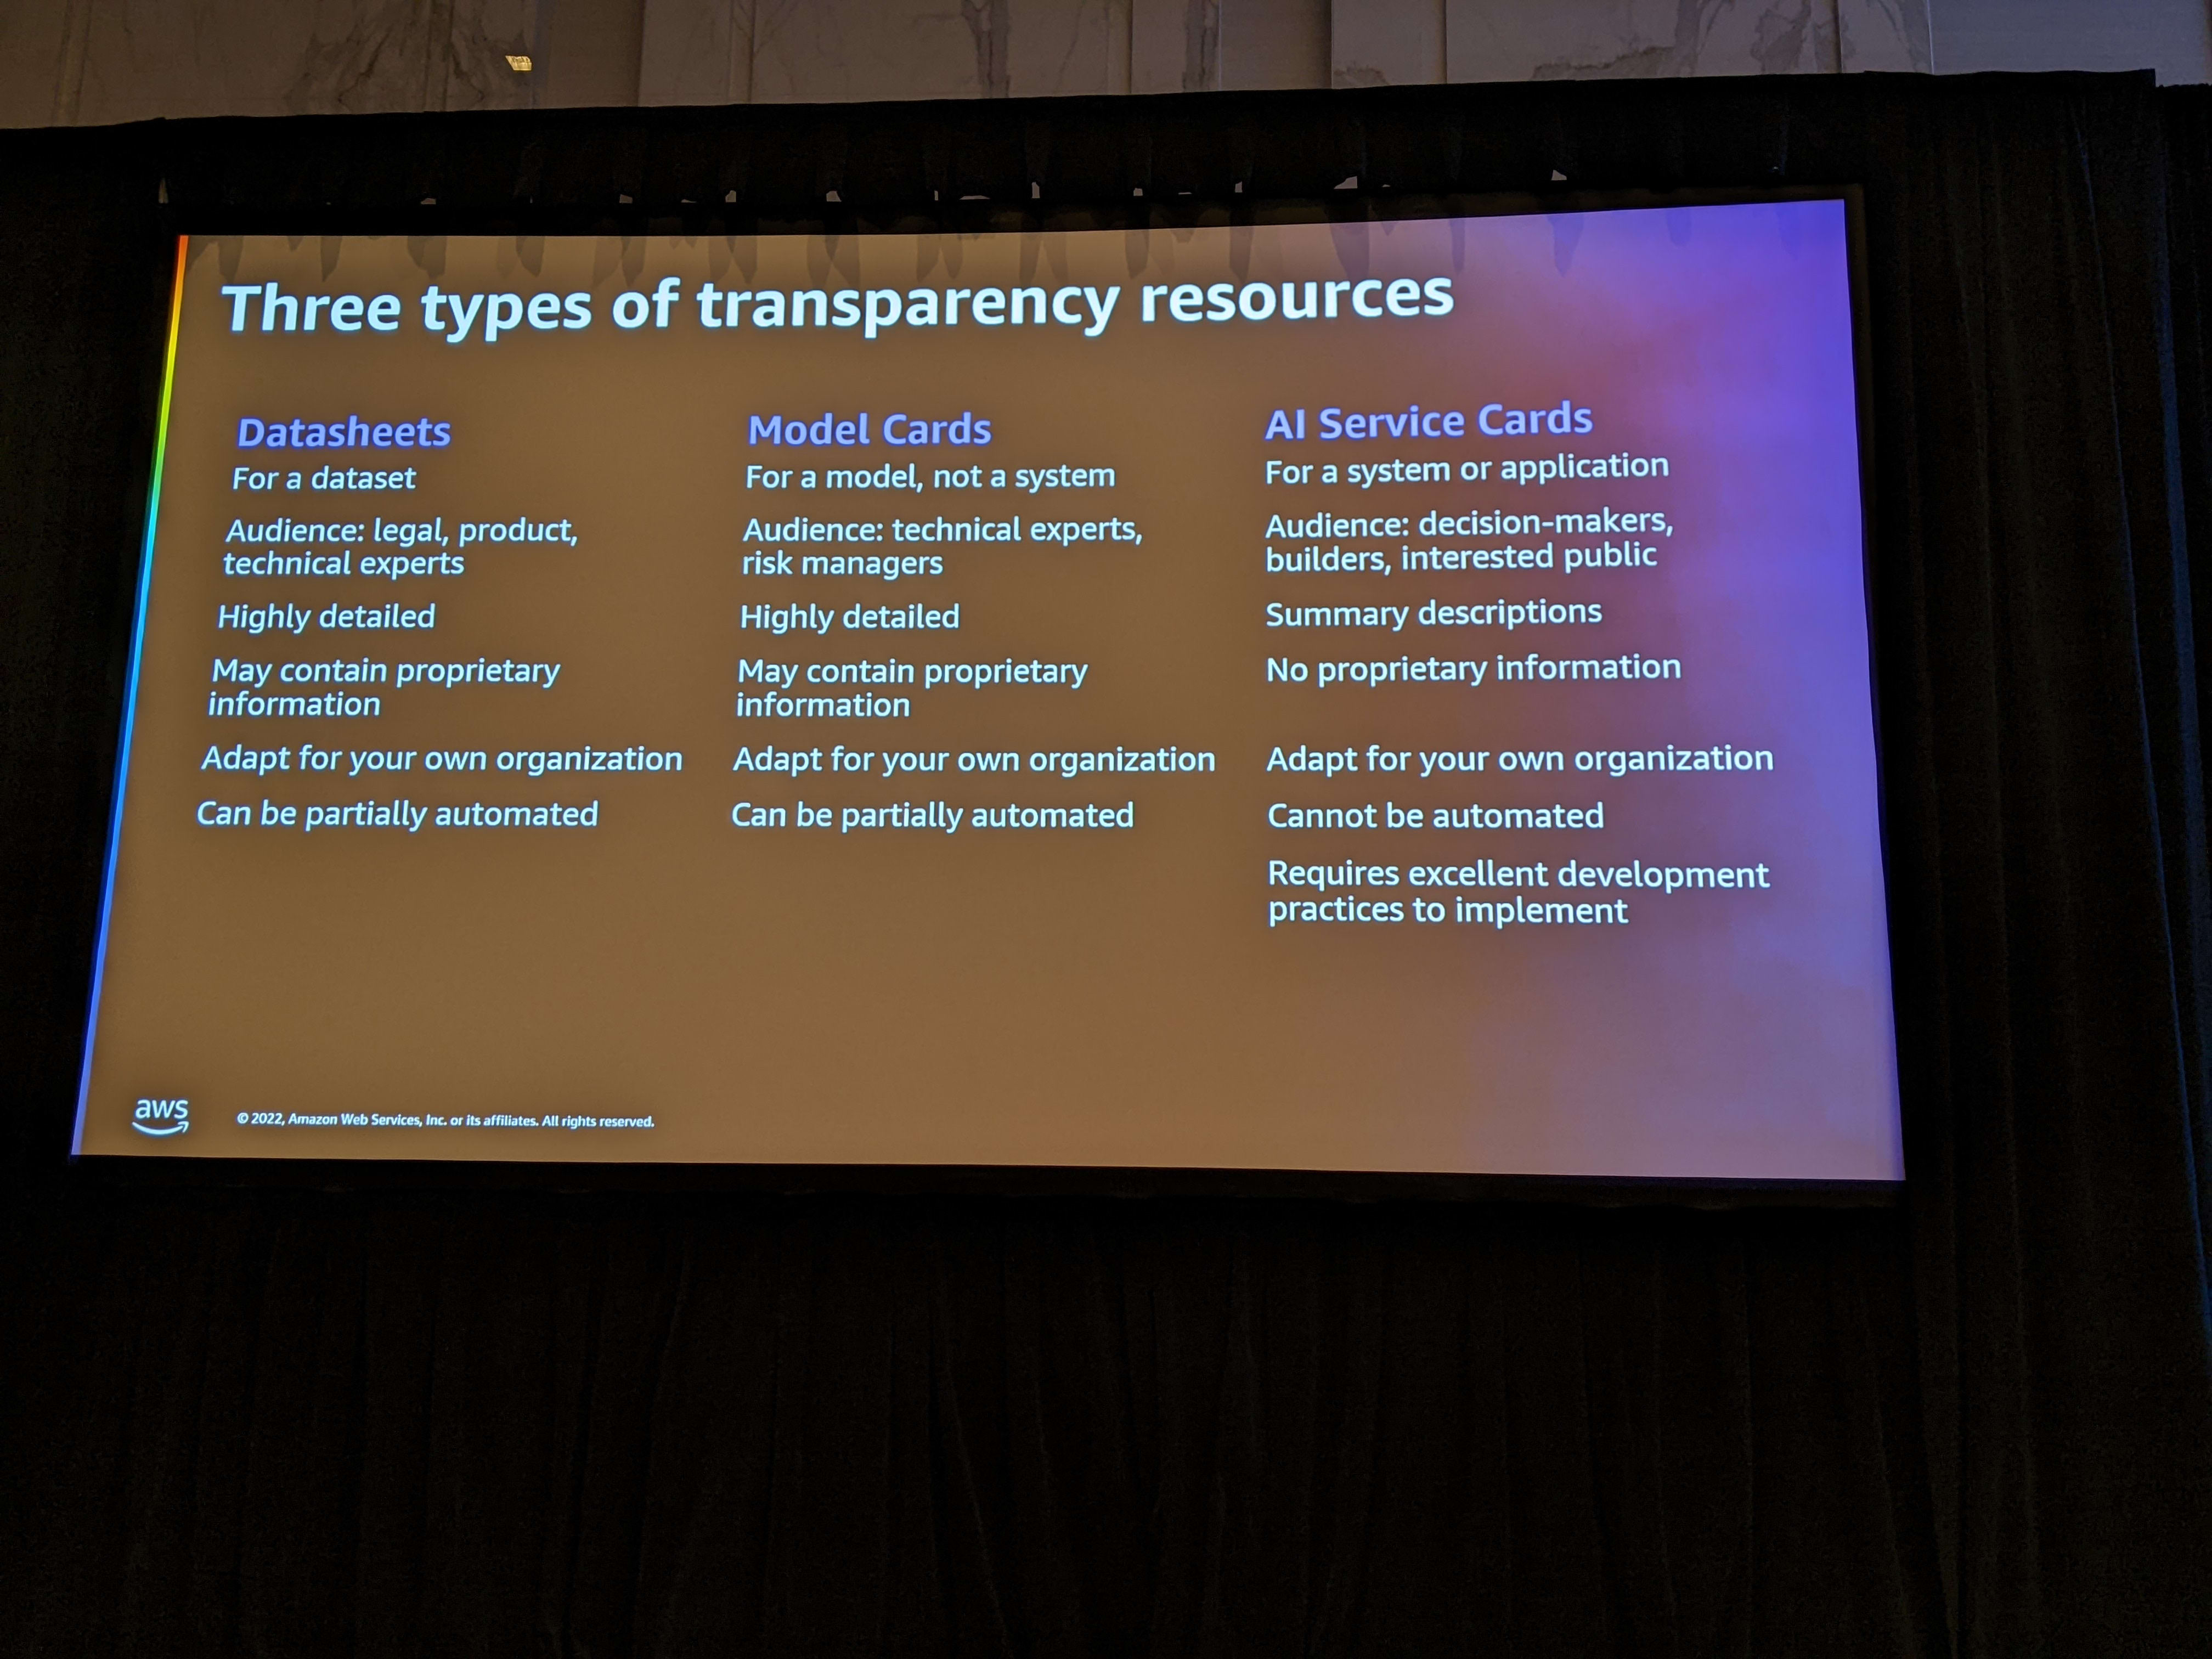
The AWS team finally closed the session by introducing their latest offerings that helps in specifying the AI model, its data, potential bias so that the consumers are aware of it and can build the necessary work-arounds.
Apart from these session, I attended a session on Working Backwards. The resources on Amazon website are a much better resource and I’ll not be able to do any justice to it! So please refer to them for details!

